29
/
en
AIzaSyAYiBZKx7MnpbEhh9jyipgxe19OcubqV5w
April 1, 2024
51876
North America
NAC
false
2
1
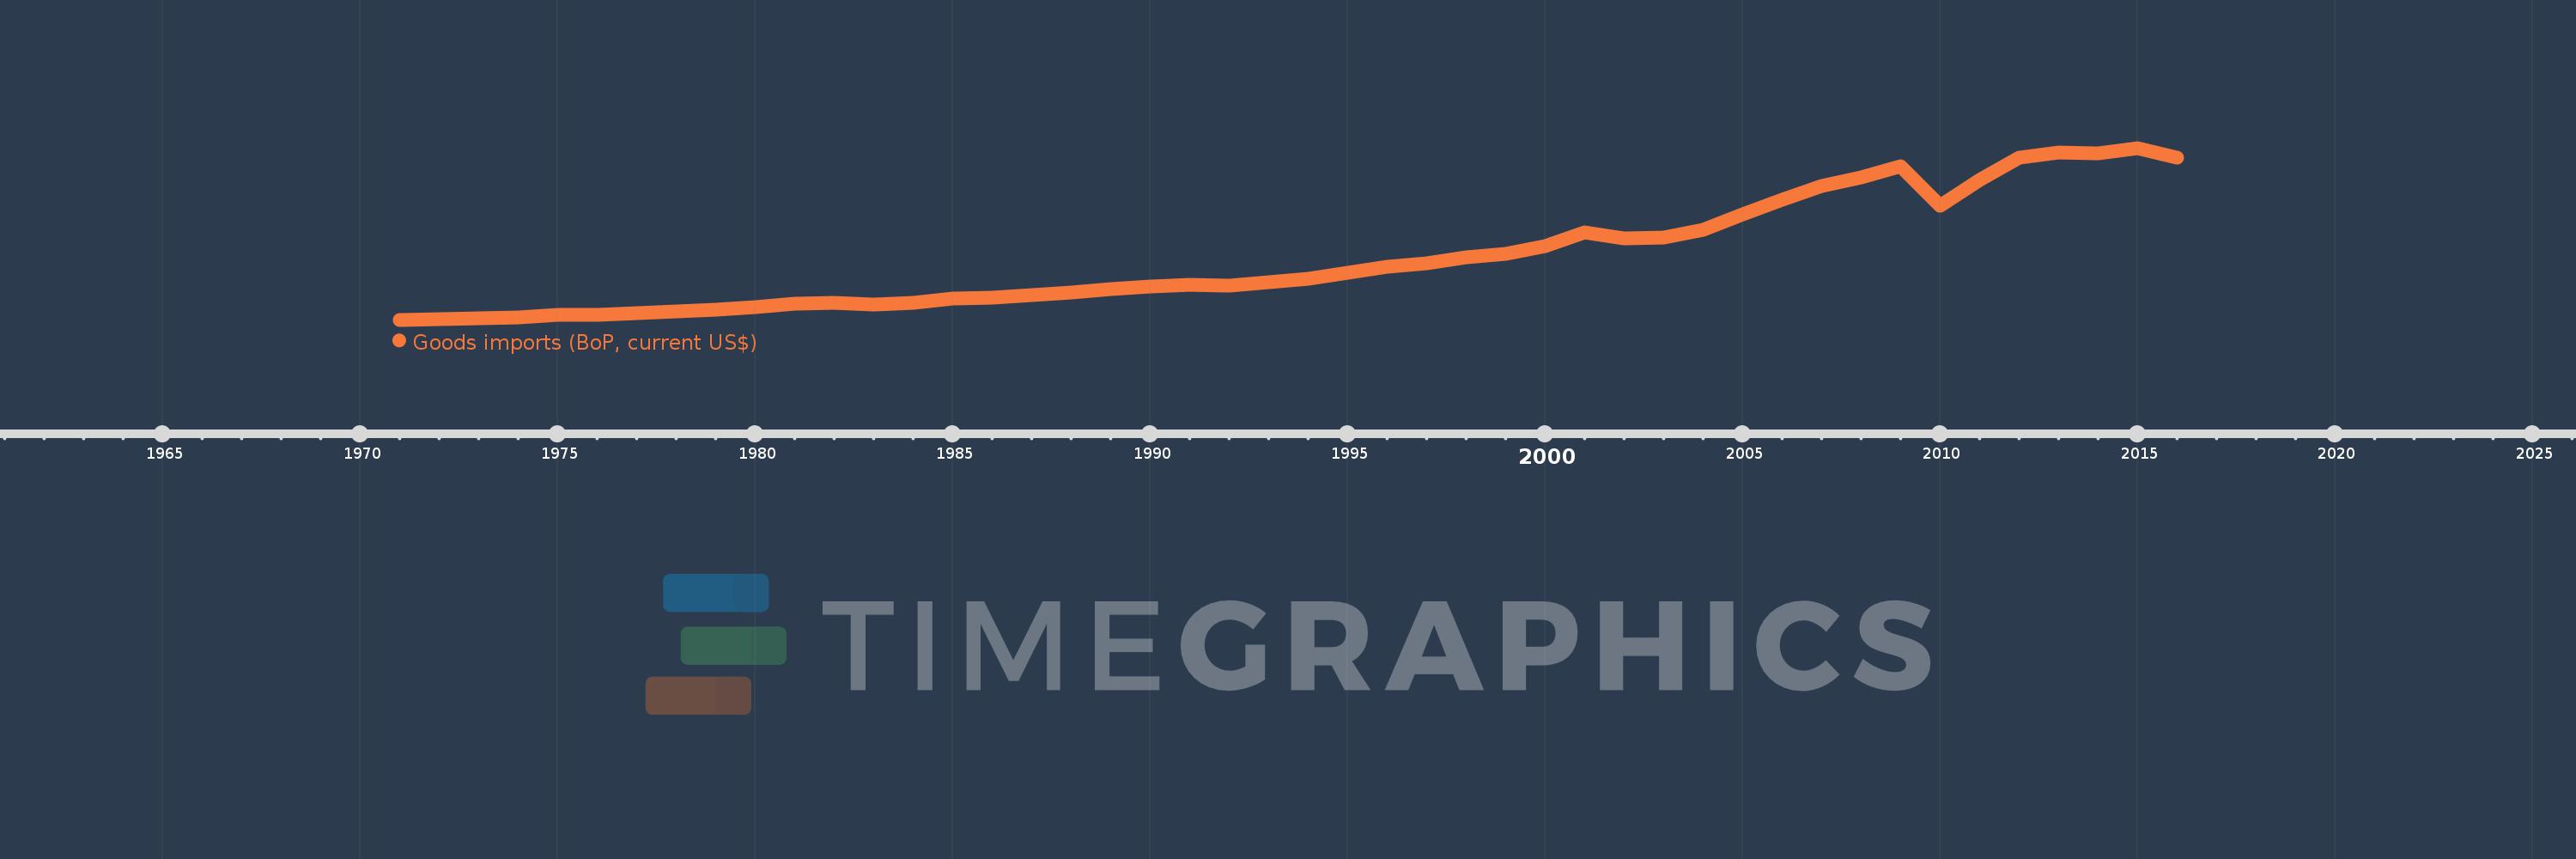
Goods imports (BoP, current US$)
2016,2015,2014,2013,2012,2011,2010,2009,2008,2007,2006,2005,2004,2003,2002,2001,2000,1999,1998,1997,1996,1995,1994,1993,1992,1991,1990,1989,1988,1987,1986,1985,1984,1983,1982,1981,1980,1979,1978,1977,1976,1975,1974,1973,1972,1971
This statistics in other country:
AfghanistanAlbaniaAlgeriaAngolaAntigua and BarbudaArab WorldArgentinaArmeniaArubaAustraliaAustriaAzerbaijanBahamas, TheBahrainBangladeshBarbadosBelarusBelgiumBelizeBeninBermudaBhutanBoliviaBosnia and HerzegovinaBotswanaBrazilBrunei DarussalamBulgariaBurkina FasoBurundiCabo VerdeCambodiaCameroonCanadaCaribbean small statesCentral African RepublicCentral Europe and the BalticsChadChileChinaColombiaComorosCongo, Dem. Rep.Congo, Rep.Costa RicaCote d'IvoireCroatiaCuracaoCyprusCzech RepublicDenmarkDjiboutiDominicaDominican RepublicEarly-demographic dividendEast Asia & PacificEast Asia & Pacific (excluding high income)East Asia & Pacific (IDA & IBRD countries)EcuadorEgypt, Arab Rep.El SalvadorEquatorial GuineaEritreaEstoniaEthiopiaEuro areaEurope & Central AsiaEurope & Central Asia (excluding high income)Europe & Central Asia (IDA & IBRD countries)European UnionFaroe IslandsFijiFinlandFragile and conflict affected situationsFranceFrench PolynesiaGabonGambia, TheGeorgiaGermanyGhanaGreeceGrenadaGuatemalaGuineaGuinea-BissauGuyanaHaitiHeavily indebted poor countries (HIPC)High incomeHondurasHong Kong SAR, ChinaHungaryIBRD onlyIcelandIDA & IBRD totalIDA blendIDA onlyIDA totalIndiaIndonesiaIran, Islamic Rep.IraqIrelandIsraelItalyJamaicaJapanJordanKazakhstanKenyaKiribatiKorea, Rep.KosovoKuwaitKyrgyz RepublicLao PDRLate-demographic dividendLatin America & Caribbean Latin America & Caribbean (excluding high income)Latin America & the Caribbean (IDA & IBRD countries)LatviaLeast developed countries: UN classificationLebanonLesothoLiberiaLibyaLithuaniaLow & middle incomeLow incomeLower middle incomeLuxembourgMacao SAR, ChinaMacedonia, FYRMadagascarMalawiMalaysiaMaldivesMaliMaltaMarshall IslandsMauritaniaMauritiusMexicoMicronesia, Fed. Sts.Middle East & North Africa (excluding high income)Middle East & North Africa (IDA & IBRD countries)Middle incomeMoldovaMongoliaMontenegroMoroccoMozambiqueMyanmarNamibiaNepalNetherlandsNew CaledoniaNew ZealandNicaraguaNigerNigeriaNorth AmericaNorwayOECD membersOmanOther small statesPacific island small statesPakistanPalauPanamaPapua New GuineaParaguayPeruPhilippinesPolandPortugalPost-demographic dividendPre-demographic dividendQatarRomaniaRussian FederationRwandaSamoaSao Tome and PrincipeSaudi ArabiaSenegalSerbiaSeychellesSierra LeoneSingaporeSint Maarten (Dutch part)Slovak RepublicSloveniaSmall statesSolomon IslandsSouth AfricaSouth AsiaSouth Asia (IDA & IBRD)South SudanSpainSri LankaSt. Kitts and NevisSt. LuciaSt. Vincent and the GrenadinesSub-Saharan Africa Sub-Saharan Africa (excluding high income)Sub-Saharan Africa (IDA & IBRD countries)SudanSurinameSwazilandSwedenSwitzerlandSyrian Arab RepublicTajikistanTanzaniaThailandTimor-LesteTogoTongaTrinidad and TobagoTunisiaTurkeyTuvaluUgandaUkraineUnited KingdomUnited StatesUpper middle incomeUruguayVanuatuVenezuela, RBVietnamWest Bank and GazaWorldYemen, Rep.ZambiaZimbabwe Timeline:
This timeline shows a graph from 1971 to 2016 of North America. No data until 1970. Number of actual observations by date: 46.
Source name:
World Development Indicators
Source organization:
International Monetary Fund, Balance of Payments Statistics Yearbook and data files.
Categories, topics:
Economy & Growth, Trade
Last updated:
apr 23, 2017
Indicators value changes by year
Minimum:
53.569 bln
jan 1, 1971
Maximum:
2.86 trl
jan 1, 2015
At the date of observation
Value
Absolute change
Change from previous value
jan 1, 1971
53.569 bln
+53.569 bln
0.0%
jan 1, 1972
61.238 bln
+7.669 bln
14.32%
jan 1, 1973
74.878 bln
+13.64 bln
22.27%
jan 1, 1974
93.903 bln
+19.025 bln
25.41%
jan 1, 1975
136.404 bln
+42.502 bln
45.26%
jan 1, 1976
132.616 bln
-3.788 bln
-2.78%
jan 1, 1977
162.453 bln
+29.837 bln
22.5%
jan 1, 1978
191.994 bln
+29.541 bln
18.18%
jan 1, 1979
219.986 bln
+27.991 bln
14.58%
jan 1, 1980
265.516 bln
+45.531 bln
20.7%
jan 1, 1981
309.516 bln
+44.0 bln
16.57%
jan 1, 1982
331.673 bln
+22.157 bln
7.16%
jan 1, 1983
302.921 bln
-28.752 bln
-8.67%
jan 1, 1984
330.203 bln
+27.282 bln
9.01%
jan 1, 1985
406.208 bln
+76.005 bln
23.02%
jan 1, 1986
416.253 bln
+10.045 bln
2.47%
jan 1, 1987
451.465 bln
+35.211 bln
8.46%
jan 1, 1988
499.925 bln
+48.46 bln
10.73%
jan 1, 1989
555.294 bln
+55.369 bln
11.08%
jan 1, 1990
595.391 bln
+40.097 bln
7.22%
jan 1, 1991
619.381 bln
+23.991 bln
4.03%
jan 1, 1992
613.902 bln
-5.479 bln
-0.88%
jan 1, 1993
664.411 bln
+50.509 bln
8.23%
jan 1, 1994
726.678 bln
+62.268 bln
9.37%
jan 1, 1995
821.021 bln
+94.343 bln
12.98%
jan 1, 1996
917.112 bln
+96.091 bln
11.7%
jan 1, 1997
977.73 bln
+60.618 bln
6.61%
jan 1, 1998
1.078 trl
+99.902 bln
10.22%
jan 1, 1999
1.124 trl
+45.965 bln
4.27%
jan 1, 2000
1.256 trl
+132.569 bln
11.8%
jan 1, 2001
1.476 trl
+219.976 bln
17.51%
jan 1, 2002
1.38 trl
-95.948 bln
-6.5%
jan 1, 2003
1.401 trl
+20.893 bln
1.51%
jan 1, 2004
1.517 trl
+116.376 bln
8.31%
jan 1, 2005
1.769 trl
+251.052 bln
16.54%
jan 1, 2006
2.017 trl
+248.185 bln
14.03%
jan 1, 2007
2.236 trl
+219.323 bln
10.88%
jan 1, 2008
2.376 trl
+139.912 bln
6.26%
jan 1, 2009
2.56 trl
+184.183 bln
7.75%
jan 1, 2010
1.91 trl
-650.201 bln
-25.4%
jan 1, 2011
2.342 trl
+431.726 bln
22.6%
jan 1, 2012
2.702 trl
+360.053 bln
15.38%
jan 1, 2013
2.78 trl
+78.12 bln
2.89%
jan 1, 2014
2.768 trl
-11.85 bln
-0.43%
jan 1, 2015
2.86 trl
+92.374 bln
3.34%
jan 1, 2016
2.702 trl
-157.892 bln
-5.52%
Ranking of countries by current statistics by years


Comments: