29
/
en
AIzaSyAYiBZKx7MnpbEhh9jyipgxe19OcubqV5w
April 1, 2024
160523
Israel
ISR
true
2
1
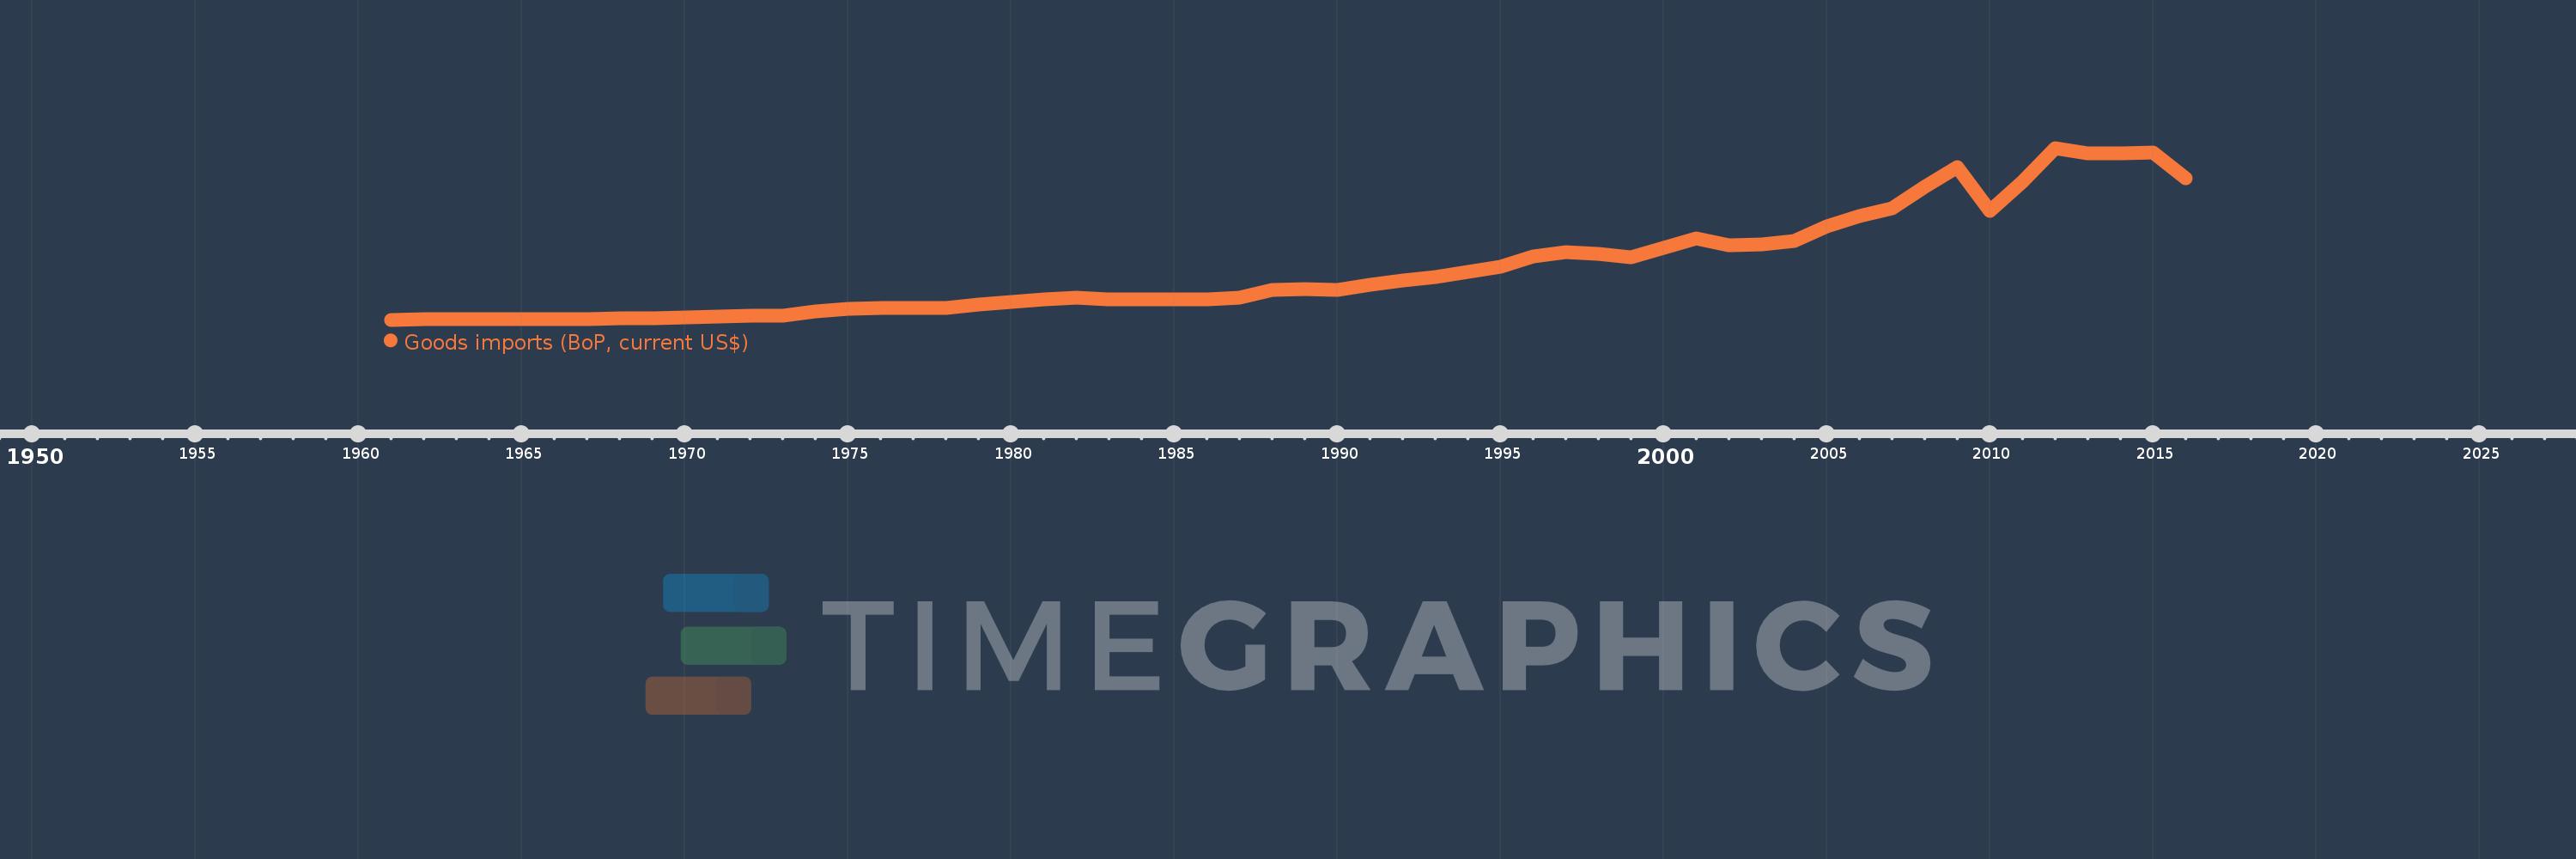
Goods imports (BoP, current US$)
2016,2015,2014,2013,2012,2011,2010,2009,2008,2007,2006,2005,2004,2003,2002,2001,2000,1999,1998,1997,1996,1995,1994,1993,1992,1991,1990,1989,1988,1987,1986,1985,1984,1983,1982,1981,1980,1979,1978,1977,1976,1975,1974,1973,1972,1971,1970,1969,1968,1967,1966,1962,1961
This statistics in other country:
AfghanistanAlbaniaAlgeriaAngolaAntigua and BarbudaArab WorldArgentinaArmeniaArubaAustraliaAustriaAzerbaijanBahamas, TheBahrainBangladeshBarbadosBelarusBelgiumBelizeBeninBermudaBhutanBoliviaBosnia and HerzegovinaBotswanaBrazilBrunei DarussalamBulgariaBurkina FasoBurundiCabo VerdeCambodiaCameroonCanadaCaribbean small statesCentral African RepublicCentral Europe and the BalticsChadChileChinaColombiaComorosCongo, Dem. Rep.Congo, Rep.Costa RicaCote d'IvoireCroatiaCuracaoCyprusCzech RepublicDenmarkDjiboutiDominicaDominican RepublicEarly-demographic dividendEast Asia & PacificEast Asia & Pacific (excluding high income)East Asia & Pacific (IDA & IBRD countries)EcuadorEgypt, Arab Rep.El SalvadorEquatorial GuineaEritreaEstoniaEthiopiaEuro areaEurope & Central AsiaEurope & Central Asia (excluding high income)Europe & Central Asia (IDA & IBRD countries)European UnionFaroe IslandsFijiFinlandFragile and conflict affected situationsFranceFrench PolynesiaGabonGambia, TheGeorgiaGermanyGhanaGreeceGrenadaGuatemalaGuineaGuinea-BissauGuyanaHaitiHeavily indebted poor countries (HIPC)High incomeHondurasHong Kong SAR, ChinaHungaryIBRD onlyIcelandIDA & IBRD totalIDA blendIDA onlyIDA totalIndiaIndonesiaIran, Islamic Rep.IraqIrelandIsraelItalyJamaicaJapanJordanKazakhstanKenyaKiribatiKorea, Rep.KosovoKuwaitKyrgyz RepublicLao PDRLate-demographic dividendLatin America & Caribbean Latin America & Caribbean (excluding high income)Latin America & the Caribbean (IDA & IBRD countries)LatviaLeast developed countries: UN classificationLebanonLesothoLiberiaLibyaLithuaniaLow & middle incomeLow incomeLower middle incomeLuxembourgMacao SAR, ChinaMacedonia, FYRMadagascarMalawiMalaysiaMaldivesMaliMaltaMarshall IslandsMauritaniaMauritiusMexicoMicronesia, Fed. Sts.Middle East & North Africa (excluding high income)Middle East & North Africa (IDA & IBRD countries)Middle incomeMoldovaMongoliaMontenegroMoroccoMozambiqueMyanmarNamibiaNepalNetherlandsNew CaledoniaNew ZealandNicaraguaNigerNigeriaNorth AmericaNorwayOECD membersOmanOther small statesPacific island small statesPakistanPalauPanamaPapua New GuineaParaguayPeruPhilippinesPolandPortugalPost-demographic dividendPre-demographic dividendQatarRomaniaRussian FederationRwandaSamoaSao Tome and PrincipeSaudi ArabiaSenegalSerbiaSeychellesSierra LeoneSingaporeSint Maarten (Dutch part)Slovak RepublicSloveniaSmall statesSolomon IslandsSouth AfricaSouth AsiaSouth Asia (IDA & IBRD)South SudanSpainSri LankaSt. Kitts and NevisSt. LuciaSt. Vincent and the GrenadinesSub-Saharan Africa Sub-Saharan Africa (excluding high income)Sub-Saharan Africa (IDA & IBRD countries)SudanSurinameSwazilandSwedenSwitzerlandSyrian Arab RepublicTajikistanTanzaniaThailandTimor-LesteTogoTongaTrinidad and TobagoTunisiaTurkeyTuvaluUgandaUkraineUnited KingdomUnited StatesUpper middle incomeUruguayVanuatuVenezuela, RBVietnamWest Bank and GazaWorldYemen, Rep.ZambiaZimbabwe Timeline:
This timeline shows a graph from 1961 to 2016 of Israel. No data until 1960. Number of actual observations by date: 53.
Source name:
World Development Indicators
Source organization:
International Monetary Fund, Balance of Payments Statistics Yearbook and data files.
Categories, topics:
Economy & Growth, Trade
Last updated:
apr 23, 2017
Indicators value changes by year
Minimum:
493.0 mln
jan 1, 1961
Maximum:
72.467 bln
jan 1, 2012
At the date of observation
Value
Absolute change
Change from previous value
jan 1, 1961
493.0 mln
+493.0 mln
0.0%
jan 1, 1962
606.0 mln
+113.0 mln
22.92%
jan 1, 1966
840.0 mln
+234.0 mln
38.61%
jan 1, 1967
865.0 mln
+25.0 mln
2.98%
jan 1, 1968
977.0 mln
+112.0 mln
12.95%
jan 1, 1969
1.265 bln
+288.0 mln
29.48%
jan 1, 1970
1.528 bln
+263.0 mln
20.79%
jan 1, 1971
1.944 bln
+416.0 mln
27.23%
jan 1, 1972
2.224 bln
+280.0 mln
14.4%
jan 1, 1973
2.307 bln
+83.0 mln
3.73%
jan 1, 1974
3.987 bln
+1.68 bln
72.82%
jan 1, 1975
5.06 bln
+1.073 bln
26.91%
jan 1, 1976
5.6 bln
+540.0 mln
10.67%
jan 1, 1977
5.345 bln
-255.0 mln
-4.55%
jan 1, 1978
5.484 bln
+139.0 mln
2.6%
jan 1, 1979
6.814 bln
+1.33 bln
24.25%
jan 1, 1980
8.088 bln
+1.274 bln
18.7%
jan 1, 1981
9.201 bln
+1.113 bln
13.76%
jan 1, 1982
9.694 bln
+492.8 mln
5.36%
jan 1, 1983
8.986 bln
-707.4 mln
-7.3%
jan 1, 1984
8.971 bln
-15.1 mln
-0.17%
jan 1, 1985
8.959 bln
-12.6 mln
-0.14%
jan 1, 1986
9.202 bln
+243.1 mln
2.71%
jan 1, 1987
9.735 bln
+532.7 mln
5.79%
jan 1, 1988
13.018 bln
+3.283 bln
33.73%
jan 1, 1989
13.241 bln
+222.7 mln
1.71%
jan 1, 1990
13.047 bln
-193.3 mln
-1.46%
jan 1, 1991
15.307 bln
+2.26 bln
17.32%
jan 1, 1992
17.093 bln
+1.786 bln
11.67%
jan 1, 1993
18.389 bln
+1.296 bln
7.58%
jan 1, 1994
20.533 bln
+2.143 bln
11.65%
jan 1, 1995
22.728 bln
+2.195 bln
10.69%
jan 1, 1996
26.964 bln
+4.236 bln
18.64%
jan 1, 1997
28.654 bln
+1.69 bln
6.27%
jan 1, 1998
28.156 bln
-497.7 mln
-1.74%
jan 1, 1999
26.618 bln
-1.538 bln
-5.46%
jan 1, 2000
30.567 bln
+3.949 bln
14.83%
jan 1, 2001
34.747 bln
+4.181 bln
13.68%
jan 1, 2002
31.738 bln
-3.009 bln
-8.66%
jan 1, 2003
31.992 bln
+254.3 mln
0.8%
jan 1, 2004
33.316 bln
+1.324 bln
4.14%
jan 1, 2005
39.507 bln
+6.192 bln
18.58%
jan 1, 2006
43.887 bln
+4.38 bln
11.09%
jan 1, 2007
47.347 bln
+3.459 bln
7.88%
jan 1, 2008
55.998 bln
+8.652 bln
18.27%
jan 1, 2009
64.423 bln
+8.424 bln
15.04%
jan 1, 2010
46.072 bln
-18.35 bln
-28.48%
jan 1, 2011
58.316 bln
+12.244 bln
26.58%
jan 1, 2012
72.467 bln
+14.151 bln
24.27%
jan 1, 2013
70.305 bln
-2.163 bln
-2.98%
jan 1, 2014
70.122 bln
-182.5 mln
-0.26%
jan 1, 2015
70.488 bln
+366.2 mln
0.52%
jan 1, 2016
59.682 bln
-10.807 bln
-15.33%
Ranking of countries by current statistics by years


Comments: