29
/
en
AIzaSyAYiBZKx7MnpbEhh9jyipgxe19OcubqV5w
April 1, 2024
264636
Togo
TGO
true
2
1
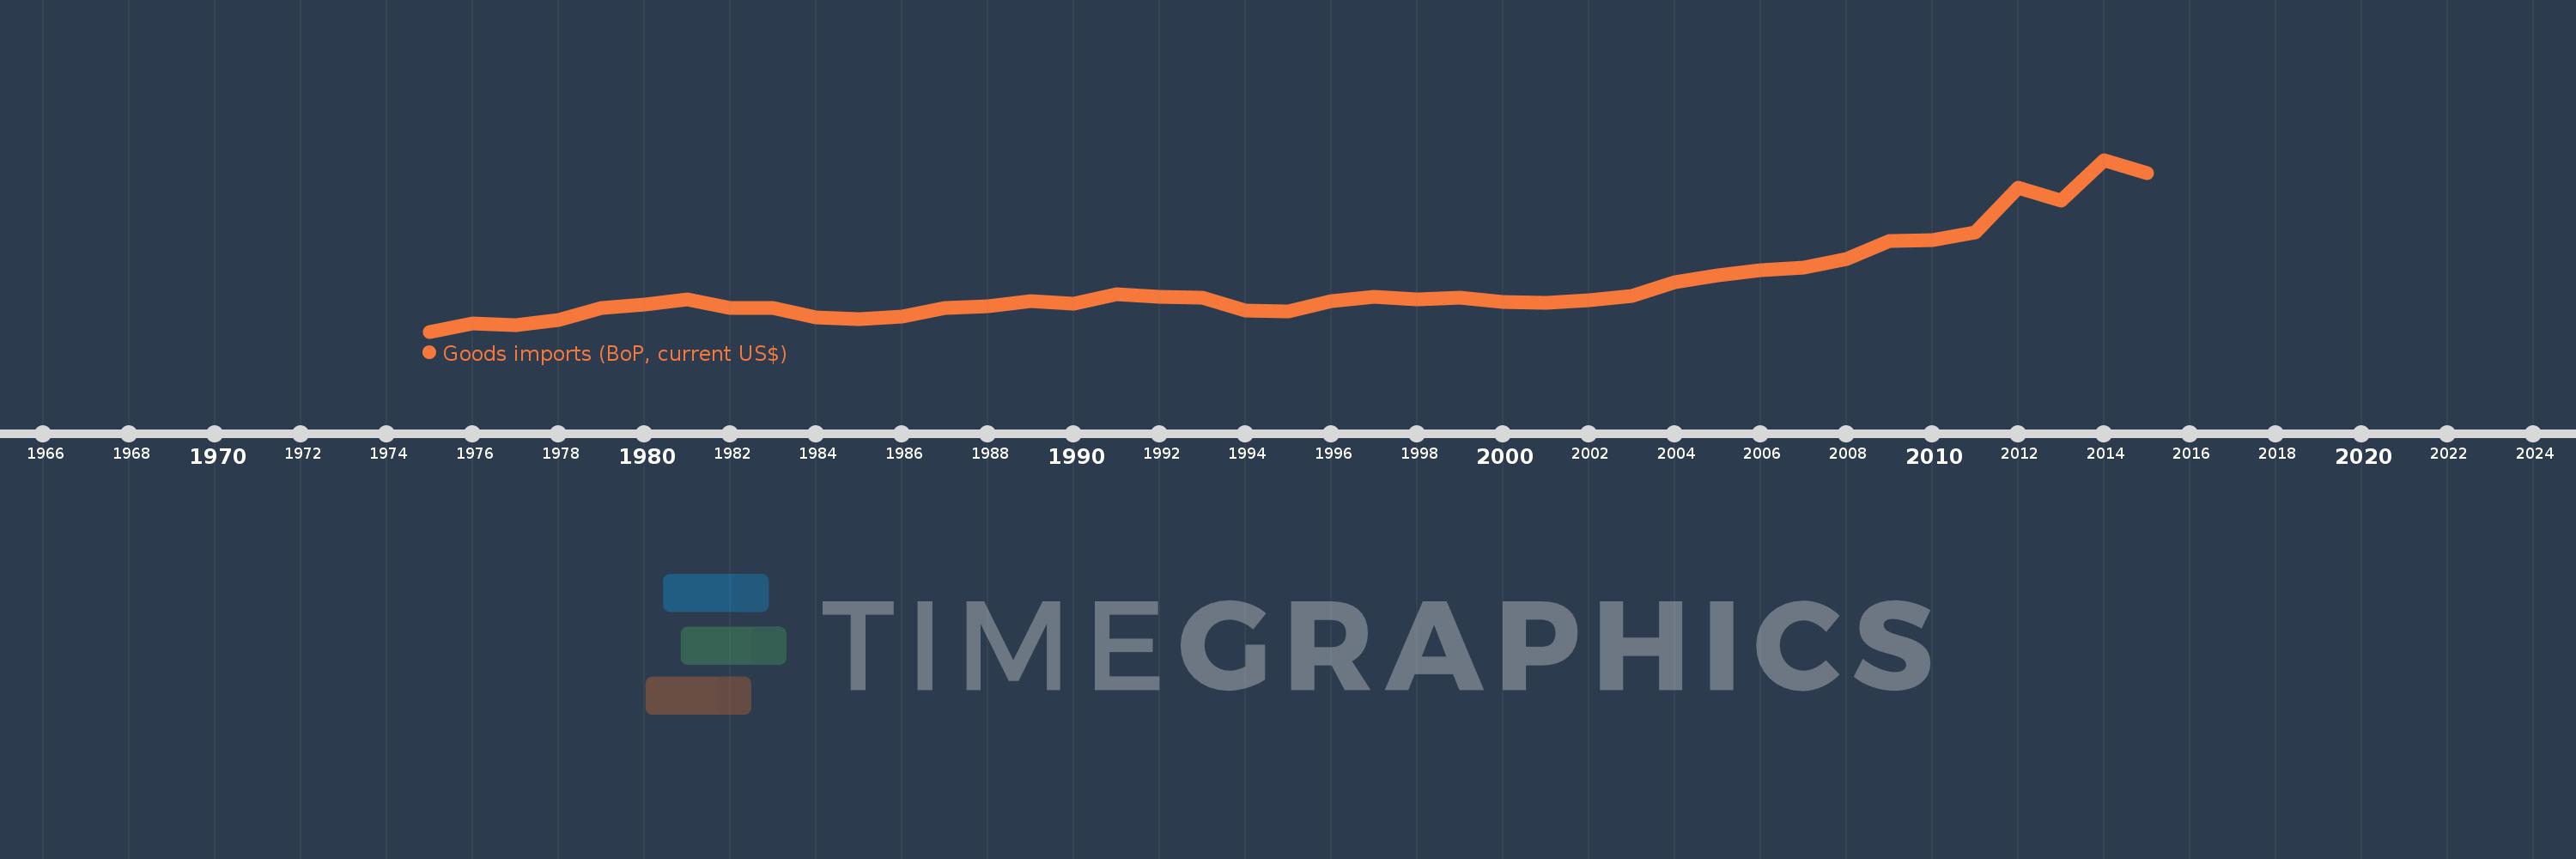
Goods imports (BoP, current US$)
2015,2014,2013,2012,2011,2010,2009,2008,2007,2006,2005,2004,2003,2002,2001,2000,1999,1998,1997,1996,1995,1994,1993,1992,1991,1990,1989,1988,1987,1986,1985,1984,1983,1982,1981,1980,1979,1978,1977,1976,1975
This statistics in other country:
AfghanistanAlbaniaAlgeriaAngolaAntigua and BarbudaArab WorldArgentinaArmeniaArubaAustraliaAustriaAzerbaijanBahamas, TheBahrainBangladeshBarbadosBelarusBelgiumBelizeBeninBermudaBhutanBoliviaBosnia and HerzegovinaBotswanaBrazilBrunei DarussalamBulgariaBurkina FasoBurundiCabo VerdeCambodiaCameroonCanadaCaribbean small statesCentral African RepublicCentral Europe and the BalticsChadChileChinaColombiaComorosCongo, Dem. Rep.Congo, Rep.Costa RicaCote d'IvoireCroatiaCuracaoCyprusCzech RepublicDenmarkDjiboutiDominicaDominican RepublicEarly-demographic dividendEast Asia & PacificEast Asia & Pacific (excluding high income)East Asia & Pacific (IDA & IBRD countries)EcuadorEgypt, Arab Rep.El SalvadorEquatorial GuineaEritreaEstoniaEthiopiaEuro areaEurope & Central AsiaEurope & Central Asia (excluding high income)Europe & Central Asia (IDA & IBRD countries)European UnionFaroe IslandsFijiFinlandFragile and conflict affected situationsFranceFrench PolynesiaGabonGambia, TheGeorgiaGermanyGhanaGreeceGrenadaGuatemalaGuineaGuinea-BissauGuyanaHaitiHeavily indebted poor countries (HIPC)High incomeHondurasHong Kong SAR, ChinaHungaryIBRD onlyIcelandIDA & IBRD totalIDA blendIDA onlyIDA totalIndiaIndonesiaIran, Islamic Rep.IraqIrelandIsraelItalyJamaicaJapanJordanKazakhstanKenyaKiribatiKorea, Rep.KosovoKuwaitKyrgyz RepublicLao PDRLate-demographic dividendLatin America & Caribbean Latin America & Caribbean (excluding high income)Latin America & the Caribbean (IDA & IBRD countries)LatviaLeast developed countries: UN classificationLebanonLesothoLiberiaLibyaLithuaniaLow & middle incomeLow incomeLower middle incomeLuxembourgMacao SAR, ChinaMacedonia, FYRMadagascarMalawiMalaysiaMaldivesMaliMaltaMarshall IslandsMauritaniaMauritiusMexicoMicronesia, Fed. Sts.Middle East & North Africa (excluding high income)Middle East & North Africa (IDA & IBRD countries)Middle incomeMoldovaMongoliaMontenegroMoroccoMozambiqueMyanmarNamibiaNepalNetherlandsNew CaledoniaNew ZealandNicaraguaNigerNigeriaNorth AmericaNorwayOECD membersOmanOther small statesPacific island small statesPakistanPalauPanamaPapua New GuineaParaguayPeruPhilippinesPolandPortugalPost-demographic dividendPre-demographic dividendQatarRomaniaRussian FederationRwandaSamoaSao Tome and PrincipeSaudi ArabiaSenegalSerbiaSeychellesSierra LeoneSingaporeSint Maarten (Dutch part)Slovak RepublicSloveniaSmall statesSolomon IslandsSouth AfricaSouth AsiaSouth Asia (IDA & IBRD)South SudanSpainSri LankaSt. Kitts and NevisSt. LuciaSt. Vincent and the GrenadinesSub-Saharan Africa Sub-Saharan Africa (excluding high income)Sub-Saharan Africa (IDA & IBRD countries)SudanSurinameSwazilandSwedenSwitzerlandSyrian Arab RepublicTajikistanTanzaniaThailandTimor-LesteTogoTongaTrinidad and TobagoTunisiaTurkeyTuvaluUgandaUkraineUnited KingdomUnited StatesUpper middle incomeUruguayVanuatuVenezuela, RBVietnamWest Bank and GazaWorldYemen, Rep.ZambiaZimbabwe Timeline:
This timeline shows a graph from 1975 to 2015 of Togo. No data until 1974. Number of actual observations by date: 41.
Source name:
World Development Indicators
Source organization:
International Monetary Fund, Balance of Payments Statistics Yearbook and data files.
Categories, topics:
Economy & Growth, Trade
Last updated:
apr 23, 2017
Indicators value changes by year
Minimum:
98.037 mln
jan 1, 1975
Maximum:
2.392 bln
jan 1, 2014
At the date of observation
Value
Absolute change
Change from previous value
jan 1, 1975
98.037 mln
+98.037 mln
0.0%
jan 1, 1976
211.513 mln
+113.476 mln
115.75%
jan 1, 1977
180.627 mln
-30.886 mln
-14.6%
jan 1, 1978
252.74 mln
+72.112 mln
39.92%
jan 1, 1979
410.891 mln
+158.152 mln
62.57%
jan 1, 1980
464.316 mln
+53.425 mln
13.0%
jan 1, 1981
524.121 mln
+59.805 mln
12.88%
jan 1, 1982
413.938 mln
-110.183 mln
-21.02%
jan 1, 1983
408.154 mln
-5.784 mln
-1.4%
jan 1, 1984
291.776 mln
-116.378 mln
-28.51%
jan 1, 1985
263.202 mln
-28.574 mln
-9.79%
jan 1, 1986
303.749 mln
+40.546 mln
15.4%
jan 1, 1987
418.563 mln
+114.815 mln
37.8%
jan 1, 1988
437.132 mln
+18.568 mln
4.44%
jan 1, 1989
504.462 mln
+67.33 mln
15.4%
jan 1, 1990
470.126 mln
-34.336 mln
-6.81%
jan 1, 1991
602.726 mln
+132.6 mln
28.21%
jan 1, 1992
567.005 mln
-35.721 mln
-5.93%
jan 1, 1993
547.444 mln
-19.561 mln
-3.45%
jan 1, 1994
375.29 mln
-172.155 mln
-31.45%
jan 1, 1995
365.516 mln
-9.774 mln
-2.6%
jan 1, 1996
506.463 mln
+140.947 mln
38.56%
jan 1, 1997
567.772 mln
+61.309 mln
12.11%
jan 1, 1998
530.521 mln
-37.25 mln
-6.56%
jan 1, 1999
553.445 mln
+22.924 mln
4.32%
jan 1, 2000
489.419 mln
-64.026 mln
-11.57%
jan 1, 2001
484.454 mln
-4.965 mln
-1.01%
jan 1, 2002
516.064 mln
+31.61 mln
6.52%
jan 1, 2003
575.546 mln
+59.482 mln
11.53%
jan 1, 2004
754.445 mln
+178.9 mln
31.08%
jan 1, 2005
853.237 mln
+98.791 mln
13.09%
jan 1, 2006
917.424 mln
+64.187 mln
7.52%
jan 1, 2007
949.066 mln
+31.642 mln
3.45%
jan 1, 2008
1.072 bln
+122.911 mln
12.95%
jan 1, 2009
1.307 bln
+235.273 mln
21.95%
jan 1, 2010
1.315 bln
+7.915 mln
0.61%
jan 1, 2011
1.424 bln
+109.225 mln
8.31%
jan 1, 2012
2.02 bln
+595.423 mln
41.8%
jan 1, 2013
1.851 bln
-168.494 mln
-8.34%
jan 1, 2014
2.392 bln
+541.132 mln
29.23%
jan 1, 2015
2.212 bln
-180.018 mln
-7.52%
Ranking of countries by current statistics by years


Comments: