29
/
en
AIzaSyAYiBZKx7MnpbEhh9jyipgxe19OcubqV5w
April 1, 2024
257341
Switzerland
CHE
true
2
1
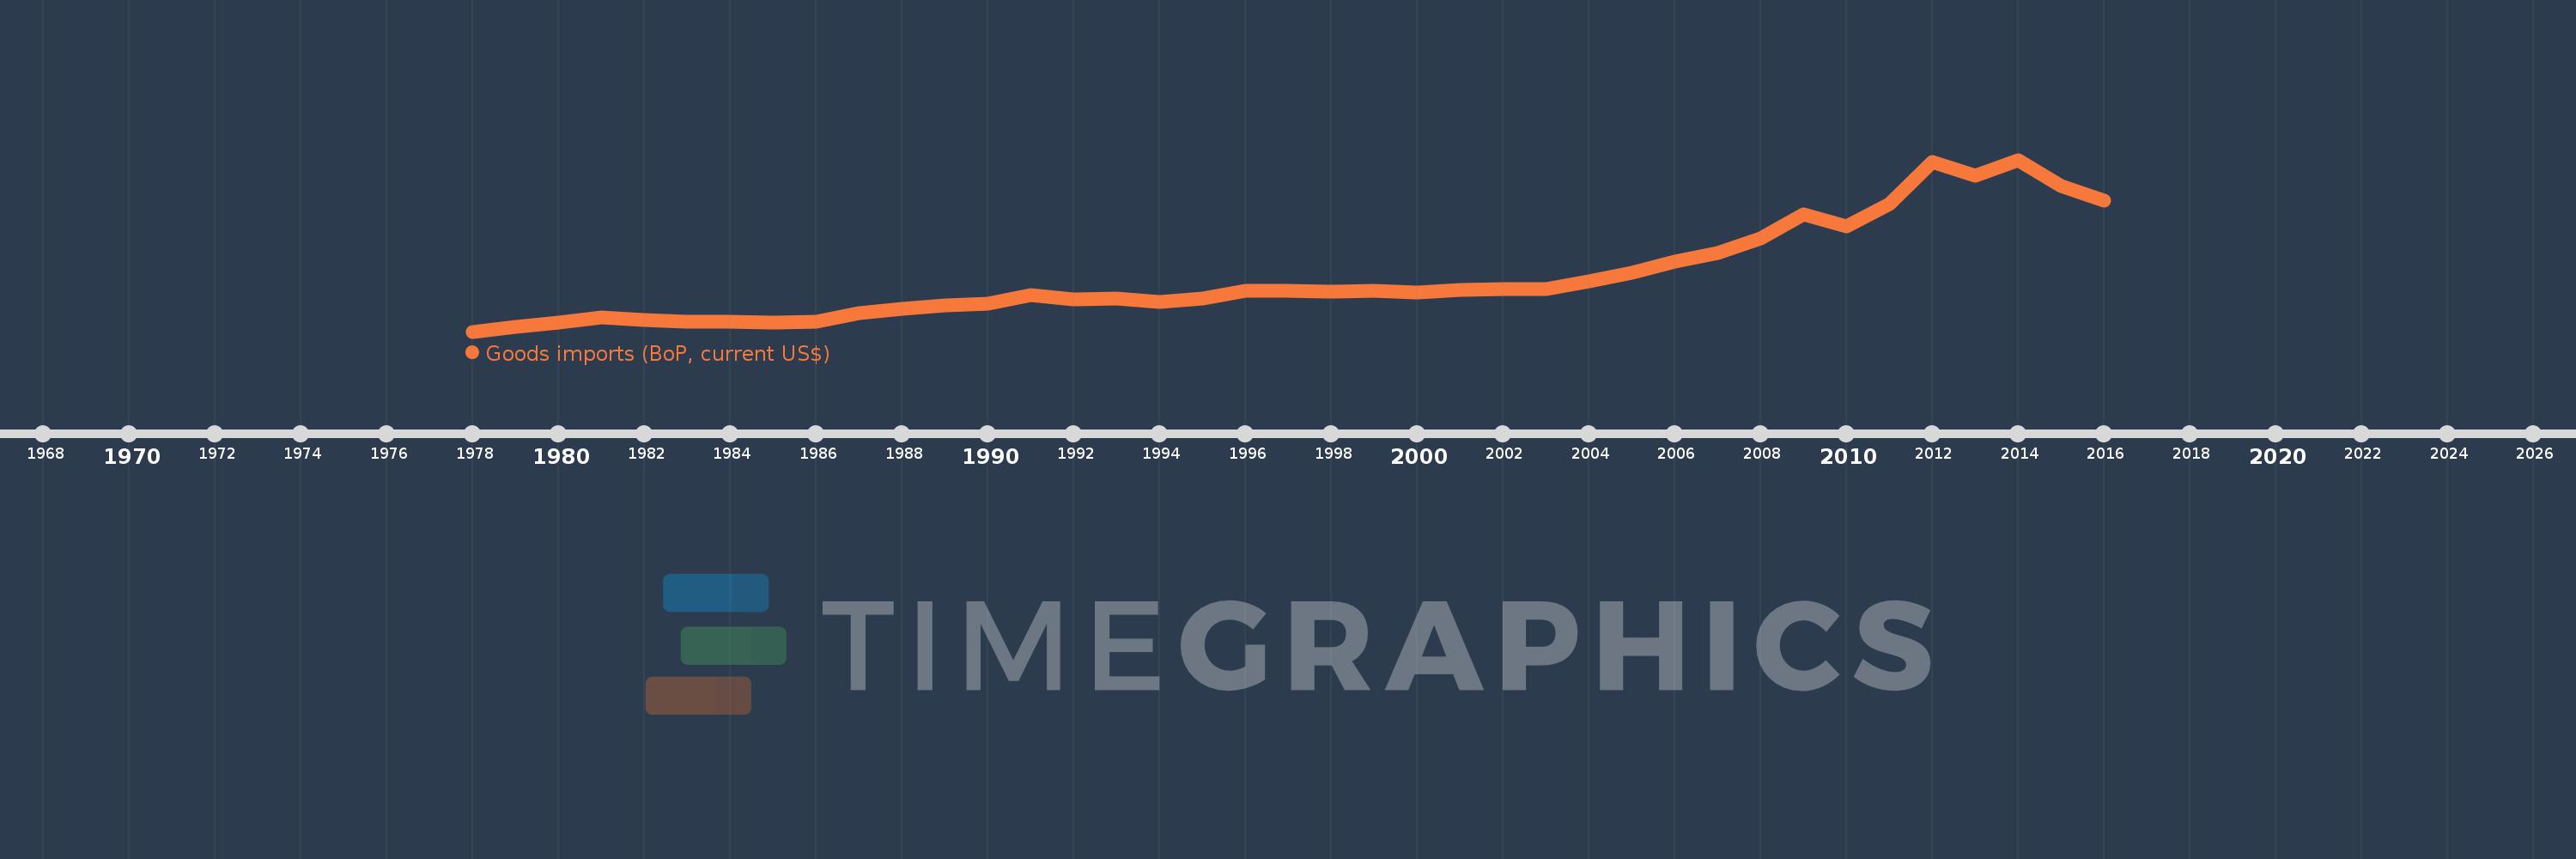
Goods imports (BoP, current US$)
2016,2015,2014,2013,2012,2011,2010,2009,2008,2007,2006,2005,2004,2003,2002,2001,2000,1999,1998,1997,1996,1995,1994,1993,1992,1991,1990,1989,1988,1987,1986,1985,1984,1983,1982,1981,1980,1979,1978
This statistics in other country:
AfghanistanAlbaniaAlgeriaAngolaAntigua and BarbudaArab WorldArgentinaArmeniaArubaAustraliaAustriaAzerbaijanBahamas, TheBahrainBangladeshBarbadosBelarusBelgiumBelizeBeninBermudaBhutanBoliviaBosnia and HerzegovinaBotswanaBrazilBrunei DarussalamBulgariaBurkina FasoBurundiCabo VerdeCambodiaCameroonCanadaCaribbean small statesCentral African RepublicCentral Europe and the BalticsChadChileChinaColombiaComorosCongo, Dem. Rep.Congo, Rep.Costa RicaCote d'IvoireCroatiaCuracaoCyprusCzech RepublicDenmarkDjiboutiDominicaDominican RepublicEarly-demographic dividendEast Asia & PacificEast Asia & Pacific (excluding high income)East Asia & Pacific (IDA & IBRD countries)EcuadorEgypt, Arab Rep.El SalvadorEquatorial GuineaEritreaEstoniaEthiopiaEuro areaEurope & Central AsiaEurope & Central Asia (excluding high income)Europe & Central Asia (IDA & IBRD countries)European UnionFaroe IslandsFijiFinlandFragile and conflict affected situationsFranceFrench PolynesiaGabonGambia, TheGeorgiaGermanyGhanaGreeceGrenadaGuatemalaGuineaGuinea-BissauGuyanaHaitiHeavily indebted poor countries (HIPC)High incomeHondurasHong Kong SAR, ChinaHungaryIBRD onlyIcelandIDA & IBRD totalIDA blendIDA onlyIDA totalIndiaIndonesiaIran, Islamic Rep.IraqIrelandIsraelItalyJamaicaJapanJordanKazakhstanKenyaKiribatiKorea, Rep.KosovoKuwaitKyrgyz RepublicLao PDRLate-demographic dividendLatin America & Caribbean Latin America & Caribbean (excluding high income)Latin America & the Caribbean (IDA & IBRD countries)LatviaLeast developed countries: UN classificationLebanonLesothoLiberiaLibyaLithuaniaLow & middle incomeLow incomeLower middle incomeLuxembourgMacao SAR, ChinaMacedonia, FYRMadagascarMalawiMalaysiaMaldivesMaliMaltaMarshall IslandsMauritaniaMauritiusMexicoMicronesia, Fed. Sts.Middle East & North Africa (excluding high income)Middle East & North Africa (IDA & IBRD countries)Middle incomeMoldovaMongoliaMontenegroMoroccoMozambiqueMyanmarNamibiaNepalNetherlandsNew CaledoniaNew ZealandNicaraguaNigerNigeriaNorth AmericaNorwayOECD membersOmanOther small statesPacific island small statesPakistanPalauPanamaPapua New GuineaParaguayPeruPhilippinesPolandPortugalPost-demographic dividendPre-demographic dividendQatarRomaniaRussian FederationRwandaSamoaSao Tome and PrincipeSaudi ArabiaSenegalSerbiaSeychellesSierra LeoneSingaporeSint Maarten (Dutch part)Slovak RepublicSloveniaSmall statesSolomon IslandsSouth AfricaSouth AsiaSouth Asia (IDA & IBRD)South SudanSpainSri LankaSt. Kitts and NevisSt. LuciaSt. Vincent and the GrenadinesSub-Saharan Africa Sub-Saharan Africa (excluding high income)Sub-Saharan Africa (IDA & IBRD countries)SudanSurinameSwazilandSwedenSwitzerlandSyrian Arab RepublicTajikistanTanzaniaThailandTimor-LesteTogoTongaTrinidad and TobagoTunisiaTurkeyTuvaluUgandaUkraineUnited KingdomUnited StatesUpper middle incomeUruguayVanuatuVenezuela, RBVietnamWest Bank and GazaWorldYemen, Rep.ZambiaZimbabwe Timeline:
This timeline shows a graph from 1978 to 2016 of Switzerland. No data until 1977. Number of actual observations by date: 39.
Source name:
World Development Indicators
Source organization:
International Monetary Fund, Balance of Payments Statistics Yearbook and data files.
Categories, topics:
Economy & Growth, Trade
Last updated:
apr 23, 2017
Indicators value changes by year
Minimum:
22.71 bln
jan 1, 1978
Maximum:
319.817 bln
jan 1, 2014
At the date of observation
Value
Absolute change
Change from previous value
jan 1, 1978
22.71 bln
+22.71 bln
0.0%
jan 1, 1979
31.014 bln
+8.304 bln
36.57%
jan 1, 1980
38.727 bln
+7.713 bln
24.87%
jan 1, 1981
46.958 bln
+8.231 bln
21.25%
jan 1, 1982
42.488 bln
-4.47 bln
-9.52%
jan 1, 1983
39.292 bln
-3.196 bln
-7.52%
jan 1, 1984
39.987 bln
+695.196 mln
1.77%
jan 1, 1985
38.509 bln
-1.478 bln
-3.7%
jan 1, 1986
39.387 bln
+877.237 mln
2.28%
jan 1, 1987
54.295 bln
+14.908 bln
37.85%
jan 1, 1988
61.621 bln
+7.326 bln
13.49%
jan 1, 1989
68.359 bln
+6.738 bln
10.93%
jan 1, 1990
70.748 bln
+2.389 bln
3.5%
jan 1, 1991
85.187 bln
+14.439 bln
20.41%
jan 1, 1992
78.836 bln
-6.351 bln
-7.46%
jan 1, 1993
80.135 bln
+1.299 bln
1.65%
jan 1, 1994
73.832 bln
-6.303 bln
-7.87%
jan 1, 1995
79.279 bln
+5.447 bln
7.38%
jan 1, 1996
93.88 bln
+14.6 bln
18.42%
jan 1, 1997
93.675 bln
-204.666 mln
-0.22%
jan 1, 1998
92.302 bln
-1.373 bln
-1.47%
jan 1, 1999
92.849 bln
+546.763 mln
0.59%
jan 1, 2000
90.944 bln
-1.905 bln
-2.05%
jan 1, 2001
94.313 bln
+3.369 bln
3.7%
jan 1, 2002
95.995 bln
+1.682 bln
1.78%
jan 1, 2003
95.868 bln
-127.007 mln
-0.13%
jan 1, 2004
110.32 bln
+14.452 bln
15.08%
jan 1, 2005
123.991 bln
+13.671 bln
12.39%
jan 1, 2006
143.418 bln
+19.427 bln
15.67%
jan 1, 2007
158.382 bln
+14.964 bln
10.43%
jan 1, 2008
183.93 bln
+25.547 bln
16.13%
jan 1, 2009
225.78 bln
+41.851 bln
22.75%
jan 1, 2010
204.199 bln
-21.582 bln
-9.56%
jan 1, 2011
242.654 bln
+38.456 bln
18.83%
jan 1, 2012
316.593 bln
+73.939 bln
30.47%
jan 1, 2013
292.491 bln
-24.102 bln
-7.61%
jan 1, 2014
319.817 bln
+27.327 bln
9.34%
jan 1, 2015
273.921 bln
-45.896 bln
-14.35%
jan 1, 2016
249.498 bln
-24.423 bln
-8.92%
Ranking of countries by current statistics by years


Comments: