29
/
en
AIzaSyAYiBZKx7MnpbEhh9jyipgxe19OcubqV5w
April 1, 2024
248748
Sri Lanka
LKA
true
2
1
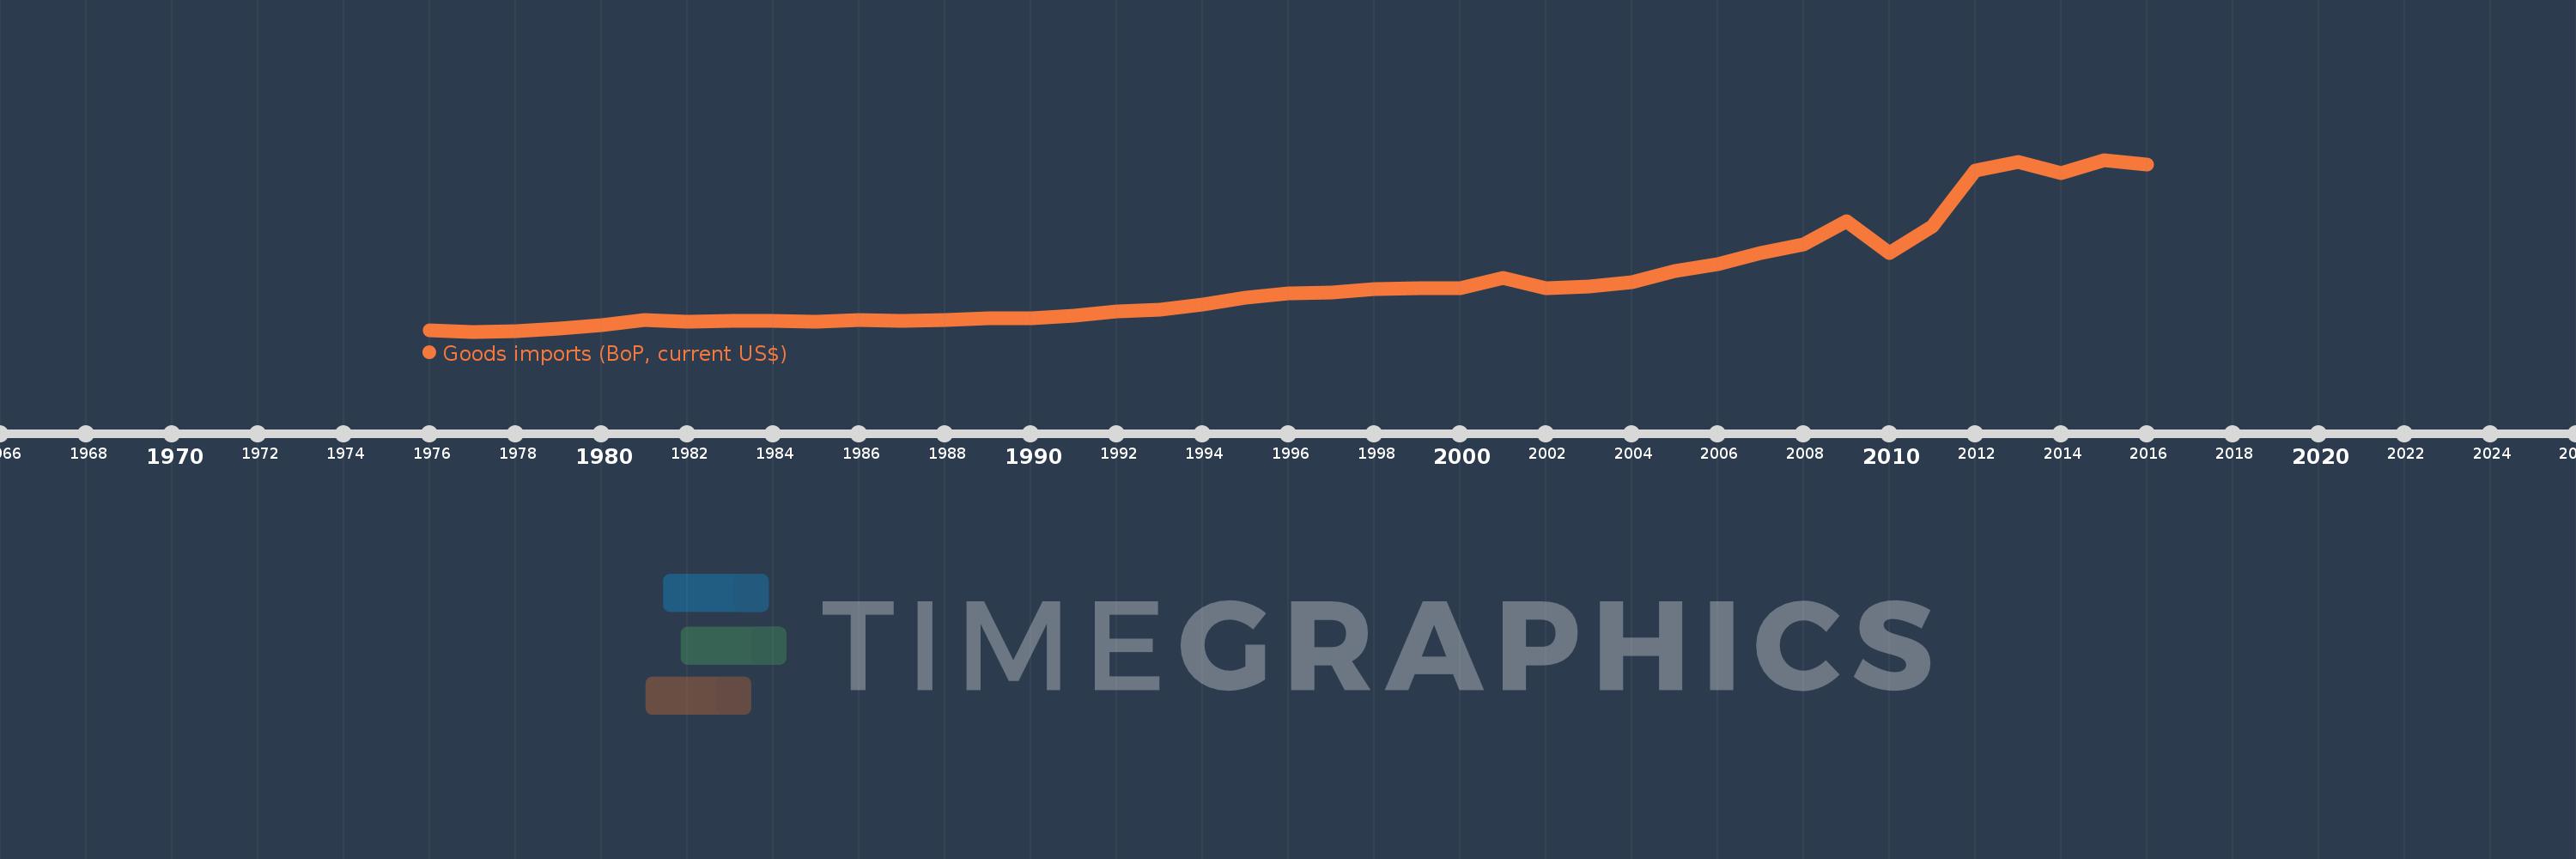
Goods imports (BoP, current US$)
2016,2015,2014,2013,2012,2011,2010,2009,2008,2007,2006,2005,2004,2003,2002,2001,2000,1999,1998,1997,1996,1995,1994,1993,1992,1991,1990,1989,1988,1987,1986,1985,1984,1983,1982,1981,1980,1979,1978,1977,1976
This statistics in other country:
AfghanistanAlbaniaAlgeriaAngolaAntigua and BarbudaArab WorldArgentinaArmeniaArubaAustraliaAustriaAzerbaijanBahamas, TheBahrainBangladeshBarbadosBelarusBelgiumBelizeBeninBermudaBhutanBoliviaBosnia and HerzegovinaBotswanaBrazilBrunei DarussalamBulgariaBurkina FasoBurundiCabo VerdeCambodiaCameroonCanadaCaribbean small statesCentral African RepublicCentral Europe and the BalticsChadChileChinaColombiaComorosCongo, Dem. Rep.Congo, Rep.Costa RicaCote d'IvoireCroatiaCuracaoCyprusCzech RepublicDenmarkDjiboutiDominicaDominican RepublicEarly-demographic dividendEast Asia & PacificEast Asia & Pacific (excluding high income)East Asia & Pacific (IDA & IBRD countries)EcuadorEgypt, Arab Rep.El SalvadorEquatorial GuineaEritreaEstoniaEthiopiaEuro areaEurope & Central AsiaEurope & Central Asia (excluding high income)Europe & Central Asia (IDA & IBRD countries)European UnionFaroe IslandsFijiFinlandFragile and conflict affected situationsFranceFrench PolynesiaGabonGambia, TheGeorgiaGermanyGhanaGreeceGrenadaGuatemalaGuineaGuinea-BissauGuyanaHaitiHeavily indebted poor countries (HIPC)High incomeHondurasHong Kong SAR, ChinaHungaryIBRD onlyIcelandIDA & IBRD totalIDA blendIDA onlyIDA totalIndiaIndonesiaIran, Islamic Rep.IraqIrelandIsraelItalyJamaicaJapanJordanKazakhstanKenyaKiribatiKorea, Rep.KosovoKuwaitKyrgyz RepublicLao PDRLate-demographic dividendLatin America & Caribbean Latin America & Caribbean (excluding high income)Latin America & the Caribbean (IDA & IBRD countries)LatviaLeast developed countries: UN classificationLebanonLesothoLiberiaLibyaLithuaniaLow & middle incomeLow incomeLower middle incomeLuxembourgMacao SAR, ChinaMacedonia, FYRMadagascarMalawiMalaysiaMaldivesMaliMaltaMarshall IslandsMauritaniaMauritiusMexicoMicronesia, Fed. Sts.Middle East & North Africa (excluding high income)Middle East & North Africa (IDA & IBRD countries)Middle incomeMoldovaMongoliaMontenegroMoroccoMozambiqueMyanmarNamibiaNepalNetherlandsNew CaledoniaNew ZealandNicaraguaNigerNigeriaNorth AmericaNorwayOECD membersOmanOther small statesPacific island small statesPakistanPalauPanamaPapua New GuineaParaguayPeruPhilippinesPolandPortugalPost-demographic dividendPre-demographic dividendQatarRomaniaRussian FederationRwandaSamoaSao Tome and PrincipeSaudi ArabiaSenegalSerbiaSeychellesSierra LeoneSingaporeSint Maarten (Dutch part)Slovak RepublicSloveniaSmall statesSolomon IslandsSouth AfricaSouth AsiaSouth Asia (IDA & IBRD)South SudanSpainSri LankaSt. Kitts and NevisSt. LuciaSt. Vincent and the GrenadinesSub-Saharan Africa Sub-Saharan Africa (excluding high income)Sub-Saharan Africa (IDA & IBRD countries)SudanSurinameSwazilandSwedenSwitzerlandSyrian Arab RepublicTajikistanTanzaniaThailandTimor-LesteTogoTongaTrinidad and TobagoTunisiaTurkeyTuvaluUgandaUkraineUnited KingdomUnited StatesUpper middle incomeUruguayVanuatuVenezuela, RBVietnamWest Bank and GazaWorldYemen, Rep.ZambiaZimbabwe Timeline:
This timeline shows a graph from 1976 to 2016 of Sri Lanka. No data until 1975. Number of actual observations by date: 41.
Source name:
World Development Indicators
Source organization:
International Monetary Fund, Balance of Payments Statistics Yearbook and data files.
Categories, topics:
Economy & Growth, Trade
Last updated:
apr 23, 2017
Indicators value changes by year
Minimum:
579.529 mln
jan 1, 1977
Maximum:
19.417 bln
jan 1, 2015
At the date of observation
Value
Absolute change
Change from previous value
jan 1, 1976
686.155 mln
+686.155 mln
0.0%
jan 1, 1977
579.529 mln
-106.625 mln
-15.54%
jan 1, 1978
655.077 mln
+75.548 mln
13.04%
jan 1, 1979
898.658 mln
+243.581 mln
37.18%
jan 1, 1980
1.304 bln
+405.651 mln
45.14%
jan 1, 1981
1.845 bln
+540.825 mln
41.46%
jan 1, 1982
1.694 bln
-150.659 mln
-8.17%
jan 1, 1983
1.794 bln
+99.824 mln
5.89%
jan 1, 1984
1.726 bln
-68.707 mln
-3.83%
jan 1, 1985
1.699 bln
-26.865 mln
-1.56%
jan 1, 1986
1.838 bln
+139.739 mln
8.23%
jan 1, 1987
1.764 bln
-74.202 mln
-4.04%
jan 1, 1988
1.866 bln
+101.757 mln
5.77%
jan 1, 1989
2.018 bln
+151.52 mln
8.12%
jan 1, 1990
2.055 bln
+37.606 mln
1.86%
jan 1, 1991
2.326 bln
+270.403 mln
13.16%
jan 1, 1992
2.808 bln
+482.47 mln
20.75%
jan 1, 1993
3.016 bln
+208.435 mln
7.42%
jan 1, 1994
3.528 bln
+511.348 mln
16.95%
jan 1, 1995
4.293 bln
+765.564 mln
21.7%
jan 1, 1996
4.783 bln
+489.248 mln
11.4%
jan 1, 1997
4.895 bln
+112.334 mln
2.35%
jan 1, 1998
5.278 bln
+383.329 mln
7.83%
jan 1, 1999
5.313 bln
+35.122 mln
0.67%
jan 1, 2000
5.365 bln
+52.056 mln
0.98%
jan 1, 2001
6.484 bln
+1.118 bln
20.84%
jan 1, 2002
5.377 bln
-1.107 bln
-17.07%
jan 1, 2003
5.495 bln
+118.116 mln
2.2%
jan 1, 2004
6.005 bln
+509.742 mln
9.28%
jan 1, 2005
7.2 bln
+1.195 bln
19.9%
jan 1, 2006
7.977 bln
+777.037 mln
10.79%
jan 1, 2007
9.228 bln
+1.251 bln
15.68%
jan 1, 2008
10.167 bln
+939.24 mln
10.18%
jan 1, 2009
12.682 bln
+2.515 bln
24.74%
jan 1, 2010
9.186 bln
-3.496 bln
-27.57%
jan 1, 2011
12.106 bln
+2.92 bln
31.79%
jan 1, 2012
18.242 bln
+6.136 bln
50.69%
jan 1, 2013
19.19 bln
+948.274 mln
5.2%
jan 1, 2014
18.003 bln
-1.187 bln
-6.19%
jan 1, 2015
19.417 bln
+1.414 bln
7.85%
jan 1, 2016
18.935 bln
-482.17 mln
-2.48%
Ranking of countries by current statistics by years


Comments: