29
/
en
AIzaSyAYiBZKx7MnpbEhh9jyipgxe19OcubqV5w
April 1, 2024
28150
East Asia & Pacific (excluding high income)
EAP
false
2
1
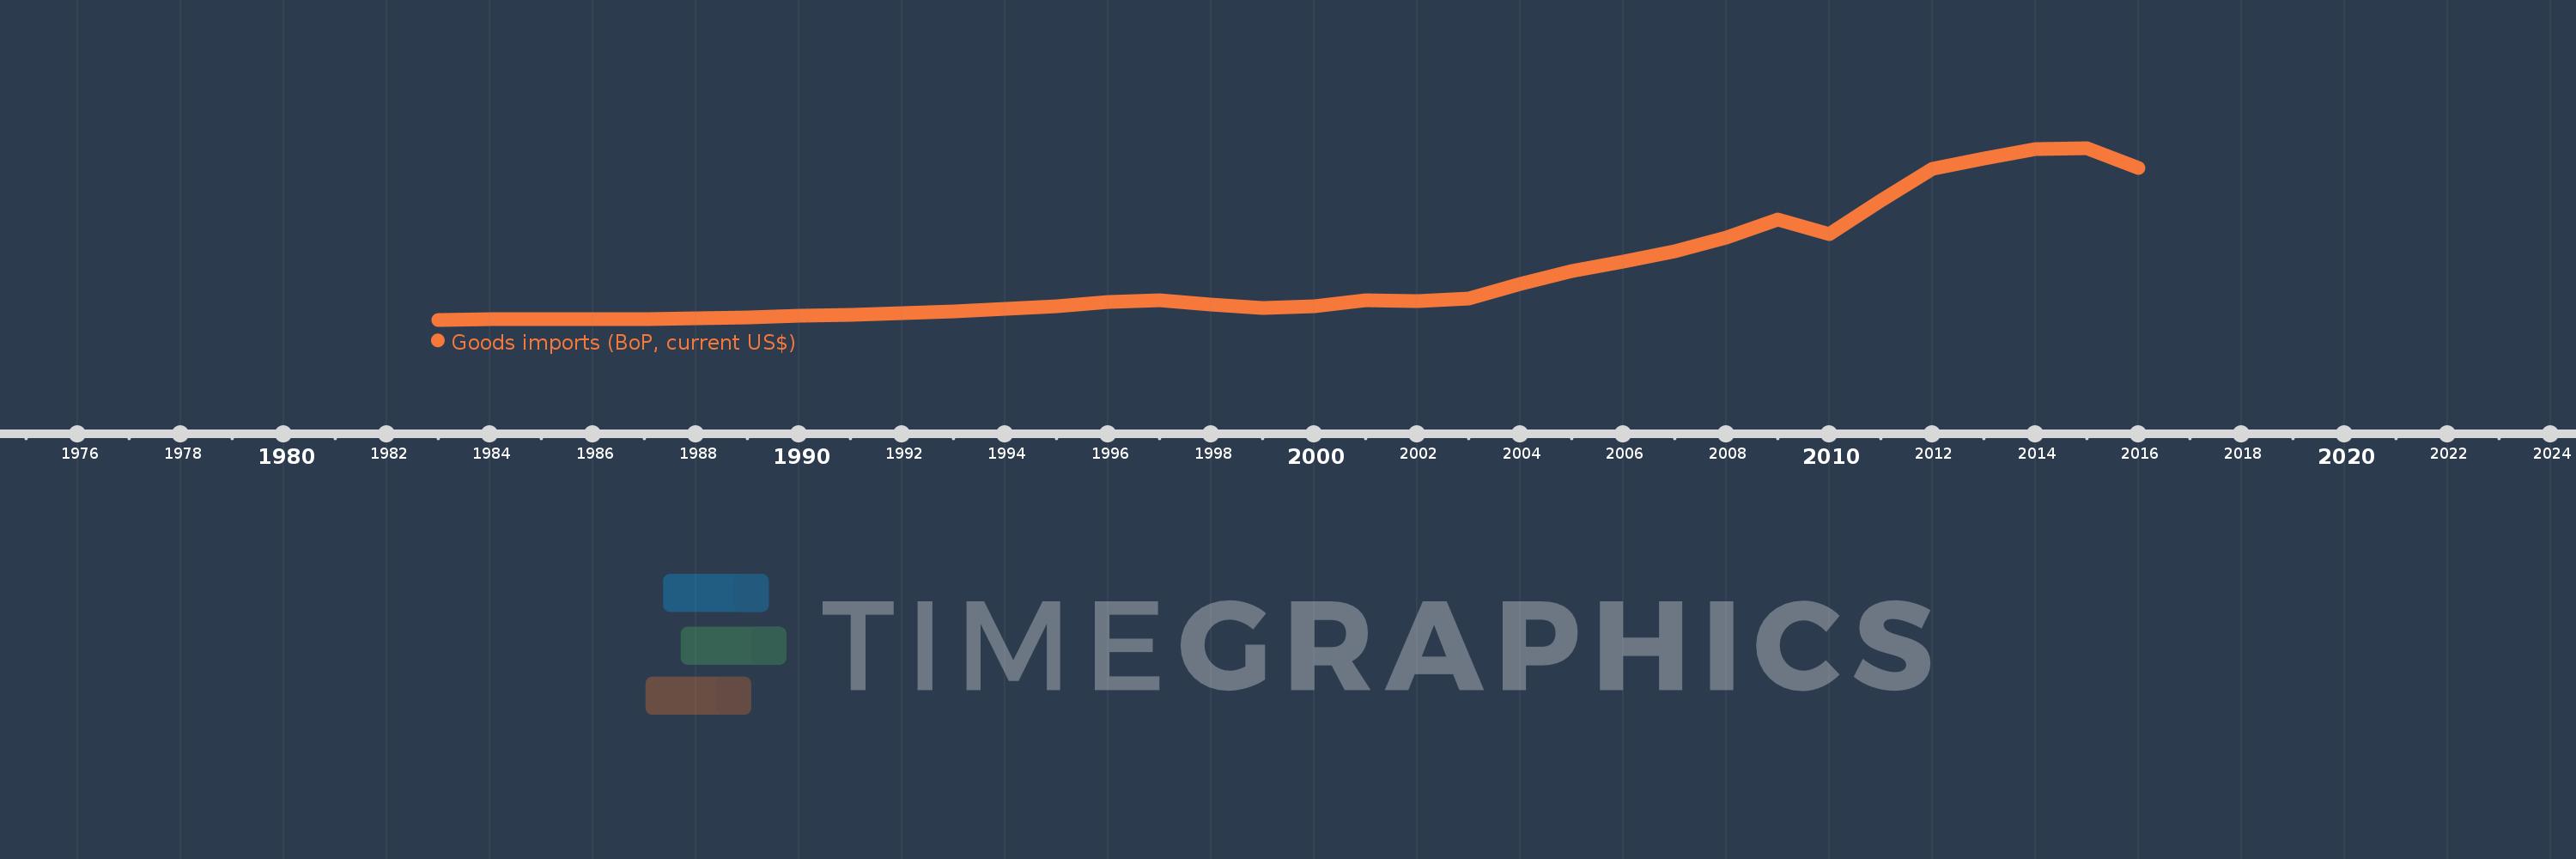
Goods imports (BoP, current US$)
2016,2015,2014,2013,2012,2011,2010,2009,2008,2007,2006,2005,2004,2003,2002,2001,2000,1999,1998,1997,1996,1995,1994,1993,1992,1991,1990,1989,1988,1987,1986,1985,1984,1983
This statistics in other country:
AfghanistanAlbaniaAlgeriaAngolaAntigua and BarbudaArab WorldArgentinaArmeniaArubaAustraliaAustriaAzerbaijanBahamas, TheBahrainBangladeshBarbadosBelarusBelgiumBelizeBeninBermudaBhutanBoliviaBosnia and HerzegovinaBotswanaBrazilBrunei DarussalamBulgariaBurkina FasoBurundiCabo VerdeCambodiaCameroonCanadaCaribbean small statesCentral African RepublicCentral Europe and the BalticsChadChileChinaColombiaComorosCongo, Dem. Rep.Congo, Rep.Costa RicaCote d'IvoireCroatiaCuracaoCyprusCzech RepublicDenmarkDjiboutiDominicaDominican RepublicEarly-demographic dividendEast Asia & PacificEast Asia & Pacific (excluding high income)East Asia & Pacific (IDA & IBRD countries)EcuadorEgypt, Arab Rep.El SalvadorEquatorial GuineaEritreaEstoniaEthiopiaEuro areaEurope & Central AsiaEurope & Central Asia (excluding high income)Europe & Central Asia (IDA & IBRD countries)European UnionFaroe IslandsFijiFinlandFragile and conflict affected situationsFranceFrench PolynesiaGabonGambia, TheGeorgiaGermanyGhanaGreeceGrenadaGuatemalaGuineaGuinea-BissauGuyanaHaitiHeavily indebted poor countries (HIPC)High incomeHondurasHong Kong SAR, ChinaHungaryIBRD onlyIcelandIDA & IBRD totalIDA blendIDA onlyIDA totalIndiaIndonesiaIran, Islamic Rep.IraqIrelandIsraelItalyJamaicaJapanJordanKazakhstanKenyaKiribatiKorea, Rep.KosovoKuwaitKyrgyz RepublicLao PDRLate-demographic dividendLatin America & Caribbean Latin America & Caribbean (excluding high income)Latin America & the Caribbean (IDA & IBRD countries)LatviaLeast developed countries: UN classificationLebanonLesothoLiberiaLibyaLithuaniaLow & middle incomeLow incomeLower middle incomeLuxembourgMacao SAR, ChinaMacedonia, FYRMadagascarMalawiMalaysiaMaldivesMaliMaltaMarshall IslandsMauritaniaMauritiusMexicoMicronesia, Fed. Sts.Middle East & North Africa (excluding high income)Middle East & North Africa (IDA & IBRD countries)Middle incomeMoldovaMongoliaMontenegroMoroccoMozambiqueMyanmarNamibiaNepalNetherlandsNew CaledoniaNew ZealandNicaraguaNigerNigeriaNorth AmericaNorwayOECD membersOmanOther small statesPacific island small statesPakistanPalauPanamaPapua New GuineaParaguayPeruPhilippinesPolandPortugalPost-demographic dividendPre-demographic dividendQatarRomaniaRussian FederationRwandaSamoaSao Tome and PrincipeSaudi ArabiaSenegalSerbiaSeychellesSierra LeoneSingaporeSint Maarten (Dutch part)Slovak RepublicSloveniaSmall statesSolomon IslandsSouth AfricaSouth AsiaSouth Asia (IDA & IBRD)South SudanSpainSri LankaSt. Kitts and NevisSt. LuciaSt. Vincent and the GrenadinesSub-Saharan Africa Sub-Saharan Africa (excluding high income)Sub-Saharan Africa (IDA & IBRD countries)SudanSurinameSwazilandSwedenSwitzerlandSyrian Arab RepublicTajikistanTanzaniaThailandTimor-LesteTogoTongaTrinidad and TobagoTunisiaTurkeyTuvaluUgandaUkraineUnited KingdomUnited StatesUpper middle incomeUruguayVanuatuVenezuela, RBVietnamWest Bank and GazaWorldYemen, Rep.ZambiaZimbabwe Timeline:
This timeline shows a graph from 1983 to 2016 of East Asia & Pacific (excluding high income). No data until 1982. Number of actual observations by date: 34.
Source name:
World Development Indicators
Source organization:
International Monetary Fund, Balance of Payments Statistics Yearbook and data files.
Categories, topics:
Economy & Growth, Trade
Last updated:
apr 23, 2017
Indicators value changes by year
Minimum:
69.07 bln
jan 1, 1983
Maximum:
2.611 trl
jan 1, 2015
At the date of observation
Value
Absolute change
Change from previous value
jan 1, 1983
69.07 bln
+69.07 bln
0.0%
jan 1, 1984
72.65 bln
+3.581 bln
5.18%
jan 1, 1985
73.812 bln
+1.162 bln
1.6%
jan 1, 1986
82.298 bln
+8.486 bln
11.5%
jan 1, 1987
77.22 bln
-5.079 bln
-6.17%
jan 1, 1988
86.597 bln
+9.377 bln
12.14%
jan 1, 1989
109.576 bln
+22.979 bln
26.54%
jan 1, 1990
127.277 bln
+17.701 bln
16.15%
jan 1, 1991
140.05 bln
+12.774 bln
10.04%
jan 1, 1992
163.05 bln
+23.0 bln
16.42%
jan 1, 1993
188.046 bln
+24.995 bln
15.33%
jan 1, 1994
227.517 bln
+39.472 bln
20.99%
jan 1, 1995
265.751 bln
+38.234 bln
16.8%
jan 1, 1996
328.791 bln
+63.04 bln
23.72%
jan 1, 1997
362.223 bln
+33.432 bln
10.17%
jan 1, 1998
299.084 bln
-63.139 bln
-17.43%
jan 1, 1999
240.183 bln
-58.901 bln
-19.69%
jan 1, 2000
265.814 bln
+25.631 bln
10.67%
jan 1, 2001
351.232 bln
+85.418 bln
32.13%
jan 1, 2002
349.934 bln
-1.299 bln
-0.37%
jan 1, 2003
386.401 bln
+36.467 bln
10.42%
jan 1, 2004
604.206 bln
+217.805 bln
56.37%
jan 1, 2005
785.472 bln
+181.266 bln
30.0%
jan 1, 2006
928.806 bln
+143.334 bln
18.25%
jan 1, 2007
1.087 trl
+157.842 bln
16.99%
jan 1, 2008
1.284 trl
+197.134 bln
18.14%
jan 1, 2009
1.555 trl
+271.515 bln
21.15%
jan 1, 2010
1.33 trl
-225.418 bln
-14.49%
jan 1, 2011
1.83 trl
+500.126 bln
37.61%
jan 1, 2012
2.307 trl
+477.171 bln
26.07%
jan 1, 2013
2.45 trl
+142.729 bln
6.19%
jan 1, 2014
2.594 trl
+144.158 bln
5.88%
jan 1, 2015
2.611 trl
+16.454 bln
0.63%
jan 1, 2016
2.31 trl
-300.324 bln
-11.5%
Ranking of countries by current statistics by years


Comments: