29
/
en
AIzaSyAYiBZKx7MnpbEhh9jyipgxe19OcubqV5w
April 1, 2024
54088
Pacific island small states
PSS
false
2
1
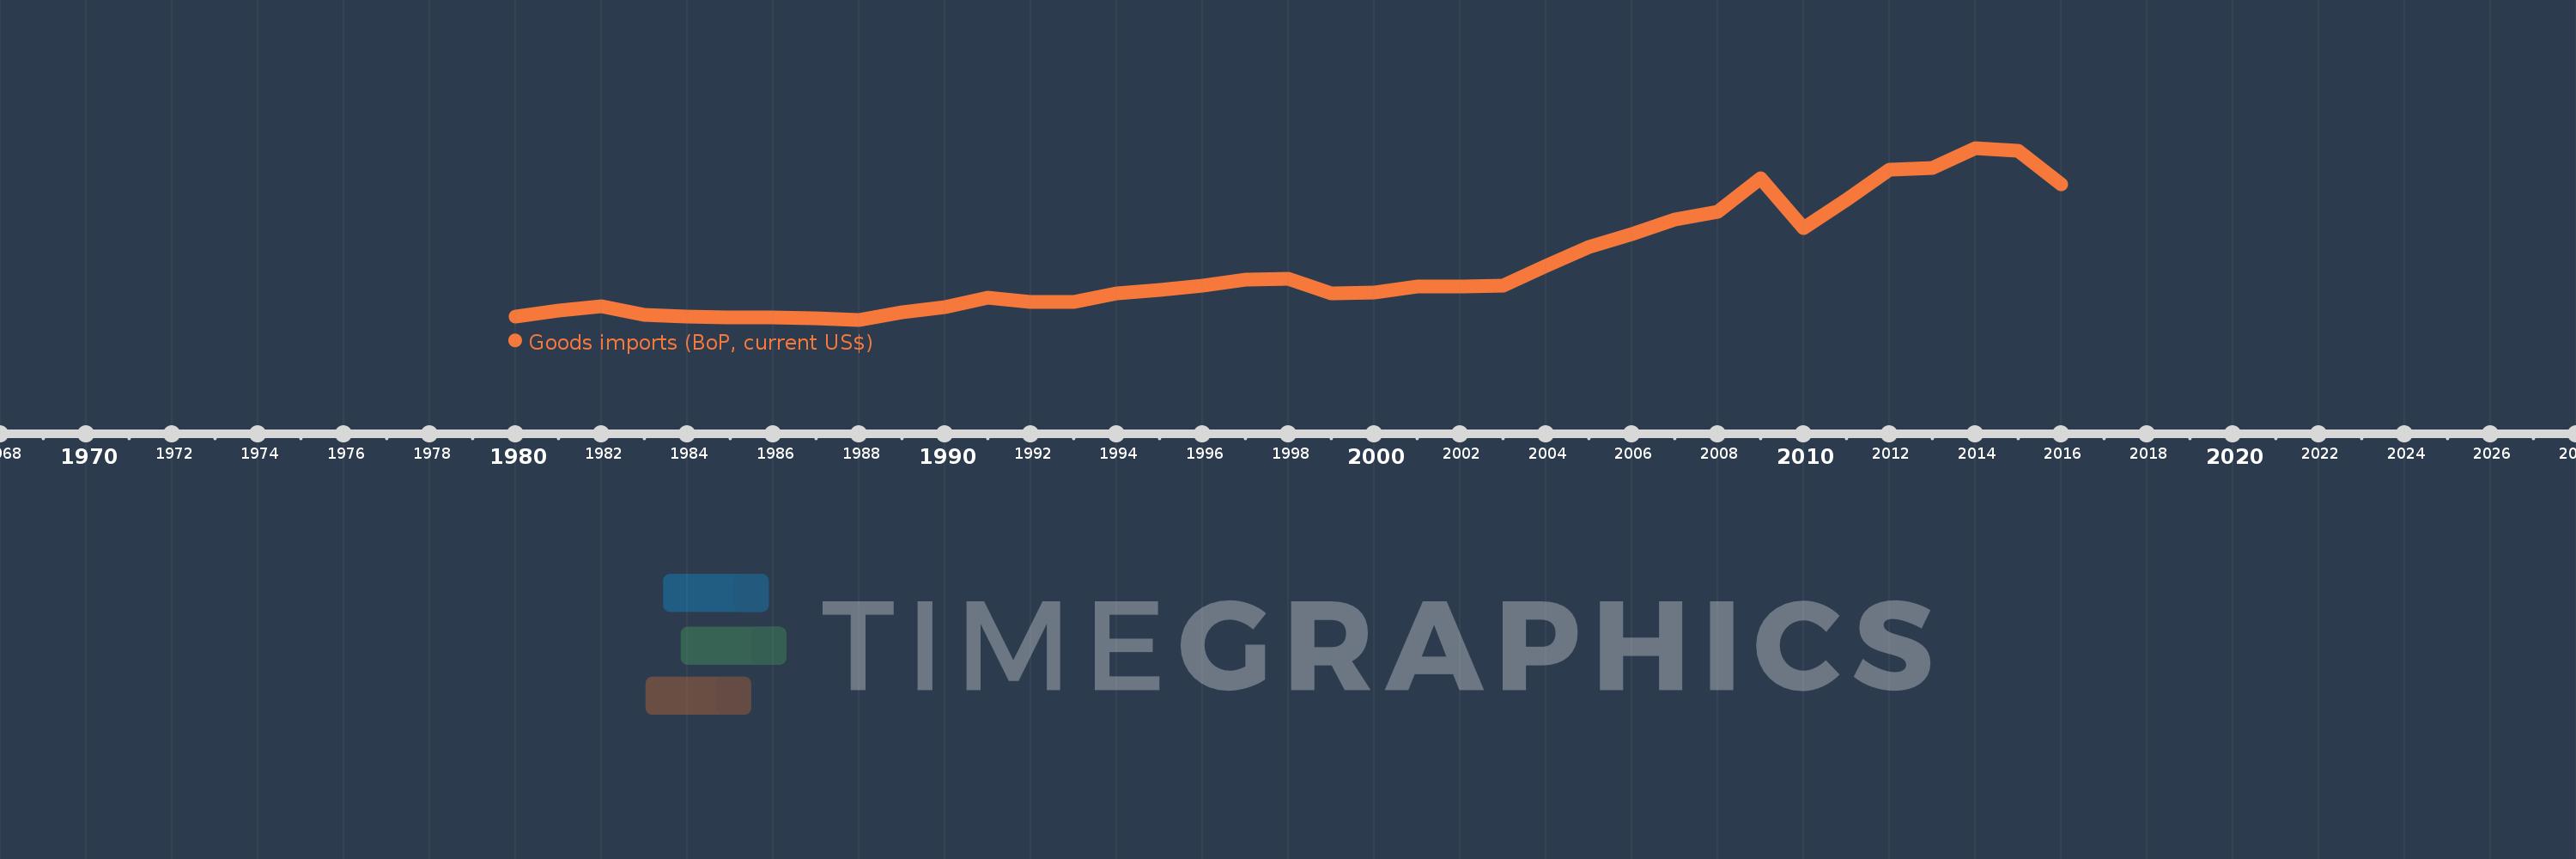
Goods imports (BoP, current US$)
2016,2015,2014,2013,2012,2011,2010,2009,2008,2007,2006,2005,2004,2003,2002,2001,2000,1999,1998,1997,1996,1995,1994,1993,1992,1991,1990,1989,1988,1987,1986,1985,1984,1983,1982,1981,1980
This statistics in other country:
AfghanistanAlbaniaAlgeriaAngolaAntigua and BarbudaArab WorldArgentinaArmeniaArubaAustraliaAustriaAzerbaijanBahamas, TheBahrainBangladeshBarbadosBelarusBelgiumBelizeBeninBermudaBhutanBoliviaBosnia and HerzegovinaBotswanaBrazilBrunei DarussalamBulgariaBurkina FasoBurundiCabo VerdeCambodiaCameroonCanadaCaribbean small statesCentral African RepublicCentral Europe and the BalticsChadChileChinaColombiaComorosCongo, Dem. Rep.Congo, Rep.Costa RicaCote d'IvoireCroatiaCuracaoCyprusCzech RepublicDenmarkDjiboutiDominicaDominican RepublicEarly-demographic dividendEast Asia & PacificEast Asia & Pacific (excluding high income)East Asia & Pacific (IDA & IBRD countries)EcuadorEgypt, Arab Rep.El SalvadorEquatorial GuineaEritreaEstoniaEthiopiaEuro areaEurope & Central AsiaEurope & Central Asia (excluding high income)Europe & Central Asia (IDA & IBRD countries)European UnionFaroe IslandsFijiFinlandFragile and conflict affected situationsFranceFrench PolynesiaGabonGambia, TheGeorgiaGermanyGhanaGreeceGrenadaGuatemalaGuineaGuinea-BissauGuyanaHaitiHeavily indebted poor countries (HIPC)High incomeHondurasHong Kong SAR, ChinaHungaryIBRD onlyIcelandIDA & IBRD totalIDA blendIDA onlyIDA totalIndiaIndonesiaIran, Islamic Rep.IraqIrelandIsraelItalyJamaicaJapanJordanKazakhstanKenyaKiribatiKorea, Rep.KosovoKuwaitKyrgyz RepublicLao PDRLate-demographic dividendLatin America & Caribbean Latin America & Caribbean (excluding high income)Latin America & the Caribbean (IDA & IBRD countries)LatviaLeast developed countries: UN classificationLebanonLesothoLiberiaLibyaLithuaniaLow & middle incomeLow incomeLower middle incomeLuxembourgMacao SAR, ChinaMacedonia, FYRMadagascarMalawiMalaysiaMaldivesMaliMaltaMarshall IslandsMauritaniaMauritiusMexicoMicronesia, Fed. Sts.Middle East & North Africa (excluding high income)Middle East & North Africa (IDA & IBRD countries)Middle incomeMoldovaMongoliaMontenegroMoroccoMozambiqueMyanmarNamibiaNepalNetherlandsNew CaledoniaNew ZealandNicaraguaNigerNigeriaNorth AmericaNorwayOECD membersOmanOther small statesPacific island small statesPakistanPalauPanamaPapua New GuineaParaguayPeruPhilippinesPolandPortugalPost-demographic dividendPre-demographic dividendQatarRomaniaRussian FederationRwandaSamoaSao Tome and PrincipeSaudi ArabiaSenegalSerbiaSeychellesSierra LeoneSingaporeSint Maarten (Dutch part)Slovak RepublicSloveniaSmall statesSolomon IslandsSouth AfricaSouth AsiaSouth Asia (IDA & IBRD)South SudanSpainSri LankaSt. Kitts and NevisSt. LuciaSt. Vincent and the GrenadinesSub-Saharan Africa Sub-Saharan Africa (excluding high income)Sub-Saharan Africa (IDA & IBRD countries)SudanSurinameSwazilandSwedenSwitzerlandSyrian Arab RepublicTajikistanTanzaniaThailandTimor-LesteTogoTongaTrinidad and TobagoTunisiaTurkeyTuvaluUgandaUkraineUnited KingdomUnited StatesUpper middle incomeUruguayVanuatuVenezuela, RBVietnamWest Bank and GazaWorldYemen, Rep.ZambiaZimbabwe Timeline:
This timeline shows a graph from 1980 to 2016 of Pacific island small states. No data until 1979. Number of actual observations by date: 37.
Source name:
World Development Indicators
Source organization:
International Monetary Fund, Balance of Payments Statistics Yearbook and data files.
Categories, topics:
Economy & Growth, Trade
Last updated:
apr 23, 2017
Indicators value changes by year
Minimum:
662.708 mln
jan 1, 1988
Maximum:
4.205 bln
jan 1, 2014
At the date of observation
Value
Absolute change
Change from previous value
jan 1, 1980
731.063 mln
+731.063 mln
0.0%
jan 1, 1981
853.273 mln
+122.21 mln
16.72%
jan 1, 1982
932.214 mln
+78.941 mln
9.25%
jan 1, 1983
760.81 mln
-171.404 mln
-18.39%
jan 1, 1984
734.164 mln
-26.647 mln
-3.5%
jan 1, 1985
715.133 mln
-19.03 mln
-2.59%
jan 1, 1986
702.946 mln
-12.187 mln
-1.7%
jan 1, 1987
685.551 mln
-17.395 mln
-2.47%
jan 1, 1988
662.708 mln
-22.843 mln
-3.33%
jan 1, 1989
809.781 mln
+147.073 mln
22.19%
jan 1, 1990
917.507 mln
+107.725 mln
13.3%
jan 1, 1991
1.112 bln
+194.695 mln
21.22%
jan 1, 1992
1.021 bln
-91.56 mln
-8.23%
jan 1, 1993
1.024 bln
+3.6 mln
0.35%
jan 1, 1994
1.208 bln
+183.268 mln
17.89%
jan 1, 1995
1.284 bln
+76.114 mln
6.3%
jan 1, 1996
1.373 bln
+89.72 mln
6.99%
jan 1, 1997
1.484 bln
+110.686 mln
8.06%
jan 1, 1998
1.51 bln
+25.746 mln
1.73%
jan 1, 1999
1.21 bln
-299.957 mln
-19.87%
jan 1, 2000
1.23 bln
+20.229 mln
1.67%
jan 1, 2001
1.353 bln
+122.663 mln
9.97%
jan 1, 2002
1.352 bln
-609.718K
-0.05%
jan 1, 2003
1.366 bln
+14.277 mln
1.06%
jan 1, 2004
1.774 bln
+407.723 mln
29.84%
jan 1, 2005
2.16 bln
+385.837 mln
21.75%
jan 1, 2006
2.43 bln
+269.73 mln
12.49%
jan 1, 2007
2.73 bln
+299.846 mln
12.34%
jan 1, 2008
2.894 bln
+164.755 mln
6.04%
jan 1, 2009
3.588 bln
+693.834 mln
23.97%
jan 1, 2010
2.545 bln
-1.043 bln
-29.07%
jan 1, 2011
3.141 bln
+596.309 mln
23.43%
jan 1, 2012
3.758 bln
+616.924 mln
19.64%
jan 1, 2013
3.801 bln
+42.645 mln
1.13%
jan 1, 2014
4.205 bln
+404.039 mln
10.63%
jan 1, 2015
4.154 bln
-50.528 mln
-1.2%
jan 1, 2016
3.458 bln
-696.813 mln
-16.77%
Ranking of countries by current statistics by years


Comments: