29
/
en
AIzaSyAYiBZKx7MnpbEhh9jyipgxe19OcubqV5w
April 1, 2024
99912
Cameroon
CMR
true
2
1
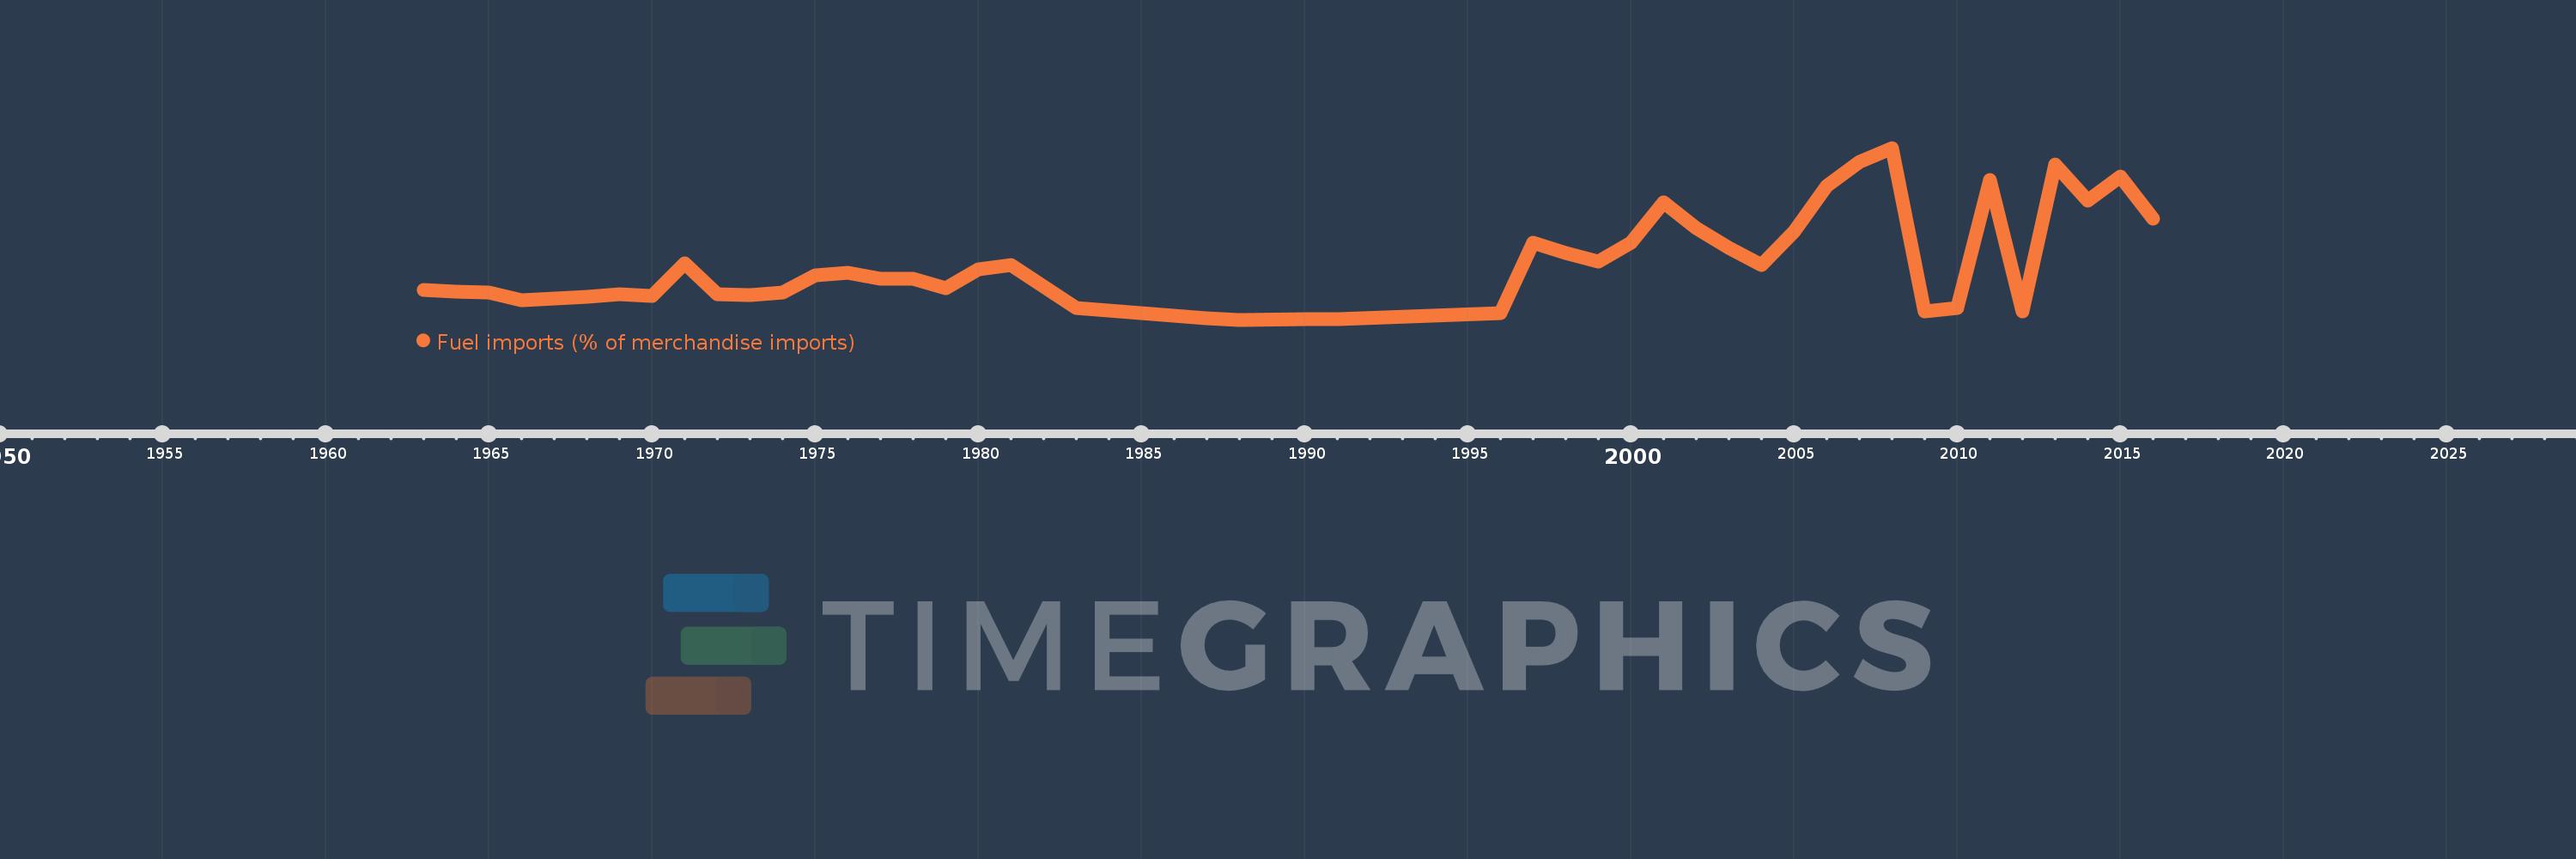
Fuel imports (% of merchandise imports)
2016,2015,2014,2013,2012,2011,2010,2009,2008,2007,2006,2005,2004,2003,2002,2001,2000,1999,1998,1997,1996,1991,1990,1988,1987,1983,1981,1980,1979,1978,1977,1976,1975,1974,1973,1972,1971,1970,1969,1968,1967,1966,1965,1964,1963
This statistics in other country:
AfghanistanAlbaniaAlgeriaAndorraAngolaAntigua and BarbudaArab WorldArgentinaArmeniaArubaAustraliaAustriaAzerbaijanBahamas, TheBahrainBangladeshBarbadosBelarusBelgiumBelizeBeninBermudaBhutanBoliviaBosnia and HerzegovinaBotswanaBrazilBrunei DarussalamBulgariaBurkina FasoBurundiCabo VerdeCambodiaCameroonCanadaCaribbean small statesCayman IslandsCentral African RepublicCentral Europe and the BalticsChadChileChinaColombiaComorosCongo, Dem. Rep.Congo, Rep.Costa RicaCote d'IvoireCroatiaCubaCyprusCzech RepublicDenmarkDjiboutiDominicaDominican RepublicEarly-demographic dividendEast Asia & PacificEast Asia & Pacific (excluding high income)East Asia & Pacific (IDA & IBRD countries)EcuadorEgypt, Arab Rep.El SalvadorEquatorial GuineaEritreaEstoniaEthiopiaEuro areaEurope & Central AsiaEurope & Central Asia (excluding high income)Europe & Central Asia (IDA & IBRD countries)European UnionFaroe IslandsFijiFinlandFragile and conflict affected situationsFranceFrench PolynesiaGabonGambia, TheGeorgiaGermanyGhanaGreeceGreenlandGrenadaGuatemalaGuineaGuinea-BissauGuyanaHaitiHeavily indebted poor countries (HIPC)High incomeHondurasHong Kong SAR, ChinaHungaryIBRD onlyIcelandIDA & IBRD totalIDA blendIDA onlyIDA totalIndiaIndonesiaIran, Islamic Rep.IraqIrelandIsraelItalyJamaicaJapanJordanKazakhstanKenyaKiribatiKorea, Rep.KuwaitKyrgyz RepublicLao PDRLate-demographic dividendLatin America & Caribbean Latin America & Caribbean (excluding high income)Latin America & the Caribbean (IDA & IBRD countries)LatviaLeast developed countries: UN classificationLebanonLesothoLiberiaLibyaLithuaniaLow & middle incomeLow incomeLower middle incomeLuxembourgMacao SAR, ChinaMacedonia, FYRMadagascarMalawiMalaysiaMaldivesMaliMaltaMauritaniaMauritiusMexicoMiddle East & North AfricaMiddle East & North Africa (excluding high income)Middle East & North Africa (IDA & IBRD countries)Middle incomeMoldovaMongoliaMoroccoMozambiqueMyanmarNamibiaNepalNetherlandsNew CaledoniaNew ZealandNicaraguaNigerNigeriaNorth AmericaNorwayOECD membersOmanOther small statesPacific island small statesPakistanPalauPanamaPapua New GuineaParaguayPeruPhilippinesPolandPortugalPost-demographic dividendPre-demographic dividendQatarRomaniaRussian FederationRwandaSamoaSao Tome and PrincipeSaudi ArabiaSenegalSerbiaSeychellesSierra LeoneSingaporeSlovak RepublicSloveniaSmall statesSolomon IslandsSomaliaSouth AfricaSouth AsiaSouth Asia (IDA & IBRD)SpainSri LankaSt. Kitts and NevisSt. LuciaSt. Vincent and the GrenadinesSub-Saharan Africa Sub-Saharan Africa (excluding high income)Sub-Saharan Africa (IDA & IBRD countries)SudanSurinameSwazilandSwedenSwitzerlandSyrian Arab RepublicTajikistanTanzaniaThailandTimor-LesteTogoTongaTrinidad and TobagoTunisiaTurkeyTurkmenistanTurks and Caicos IslandsTuvaluUgandaUkraineUnited Arab EmiratesUnited KingdomUnited StatesUpper middle incomeUruguayVanuatuVenezuela, RBVietnamVirgin Islands (U.S.)WorldYemen, Rep.ZambiaZimbabwe Timeline:
This timeline shows a graph from 1963 to 2016 of Cameroon. No data until 1962. Number of actual observations by date: 45.
Source name:
World Development Indicators
Source organization:
World Bank staff estimates from the Comtrade database maintained by the United Nations Statistics Division.
Categories, topics:
Energy & Mining, Private Sector, Trade
Last updated:
apr 23, 2017
Indicators value changes by year
Maximum:
33.403
jan 1, 2008
At the date of observation
Value
Absolute change
Change from previous value
jan 1, 1963
6.95
+6.95
0.0%
jan 1, 1964
6.622
-0.328
-4.72%
jan 1, 1965
6.438
-0.184
-2.78%
jan 1, 1966
4.981
-1.456
-22.62%
jan 1, 1967
5.385
+0.404
8.11%
jan 1, 1968
5.644
+0.258
4.79%
jan 1, 1969
6.181
+0.537
9.52%
jan 1, 1970
5.76
-0.421
-6.81%
jan 1, 1971
11.825
+6.065
105.3%
jan 1, 1972
6.143
-5.682
-48.05%
jan 1, 1973
5.963
-0.18
-2.93%
jan 1, 1974
6.393
+0.43
7.21%
jan 1, 1975
9.702
+3.309
51.76%
jan 1, 1976
10.055
+0.354
3.64%
jan 1, 1977
8.948
-1.108
-11.02%
jan 1, 1978
8.993
+0.045
0.5%
jan 1, 1979
7.175
-1.818
-20.21%
jan 1, 1980
10.787
+3.612
50.35%
jan 1, 1981
11.652
+0.865
8.02%
jan 1, 1983
3.644
-8.008
-68.73%
jan 1, 1987
1.646
-1.999
-54.84%
jan 1, 1988
1.374
-0.271
-16.49%
jan 1, 1990
1.417
+0.042
3.09%
jan 1, 1991
1.501
+0.085
5.97%
jan 1, 1996
2.531
+1.03
68.6%
jan 1, 1997
15.727
+13.196
521.4%
jan 1, 1998
13.879
-1.848
-11.75%
jan 1, 1999
12.165
-1.714
-12.35%
jan 1, 2000
15.78
+3.615
29.71%
jan 1, 2001
23.196
+7.416
47.0%
jan 1, 2002
18.388
-4.808
-20.73%
jan 1, 2003
14.752
-3.637
-19.78%
jan 1, 2004
11.628
-3.124
-21.18%
jan 1, 2005
17.803
+6.175
53.1%
jan 1, 2006
26.355
+8.552
48.04%
jan 1, 2007
30.808
+4.453
16.9%
jan 1, 2008
33.403
+2.595
8.42%
jan 1, 2009
2.923
-30.48
-91.25%
jan 1, 2010
3.546
+0.623
21.32%
jan 1, 2011
27.454
+23.908
674.18%
jan 1, 2012
2.997
-24.457
-89.08%
jan 1, 2013
30.382
+27.385
913.73%
jan 1, 2014
23.522
-6.861
-22.58%
jan 1, 2015
28.029
+4.508
19.16%
jan 1, 2016
20.249
-7.78
-27.76%
Ranking of countries by current statistics by years


Comments: