29
/
en
AIzaSyAYiBZKx7MnpbEhh9jyipgxe19OcubqV5w
April 1, 2024
277663
Uruguay
URY
true
2
1
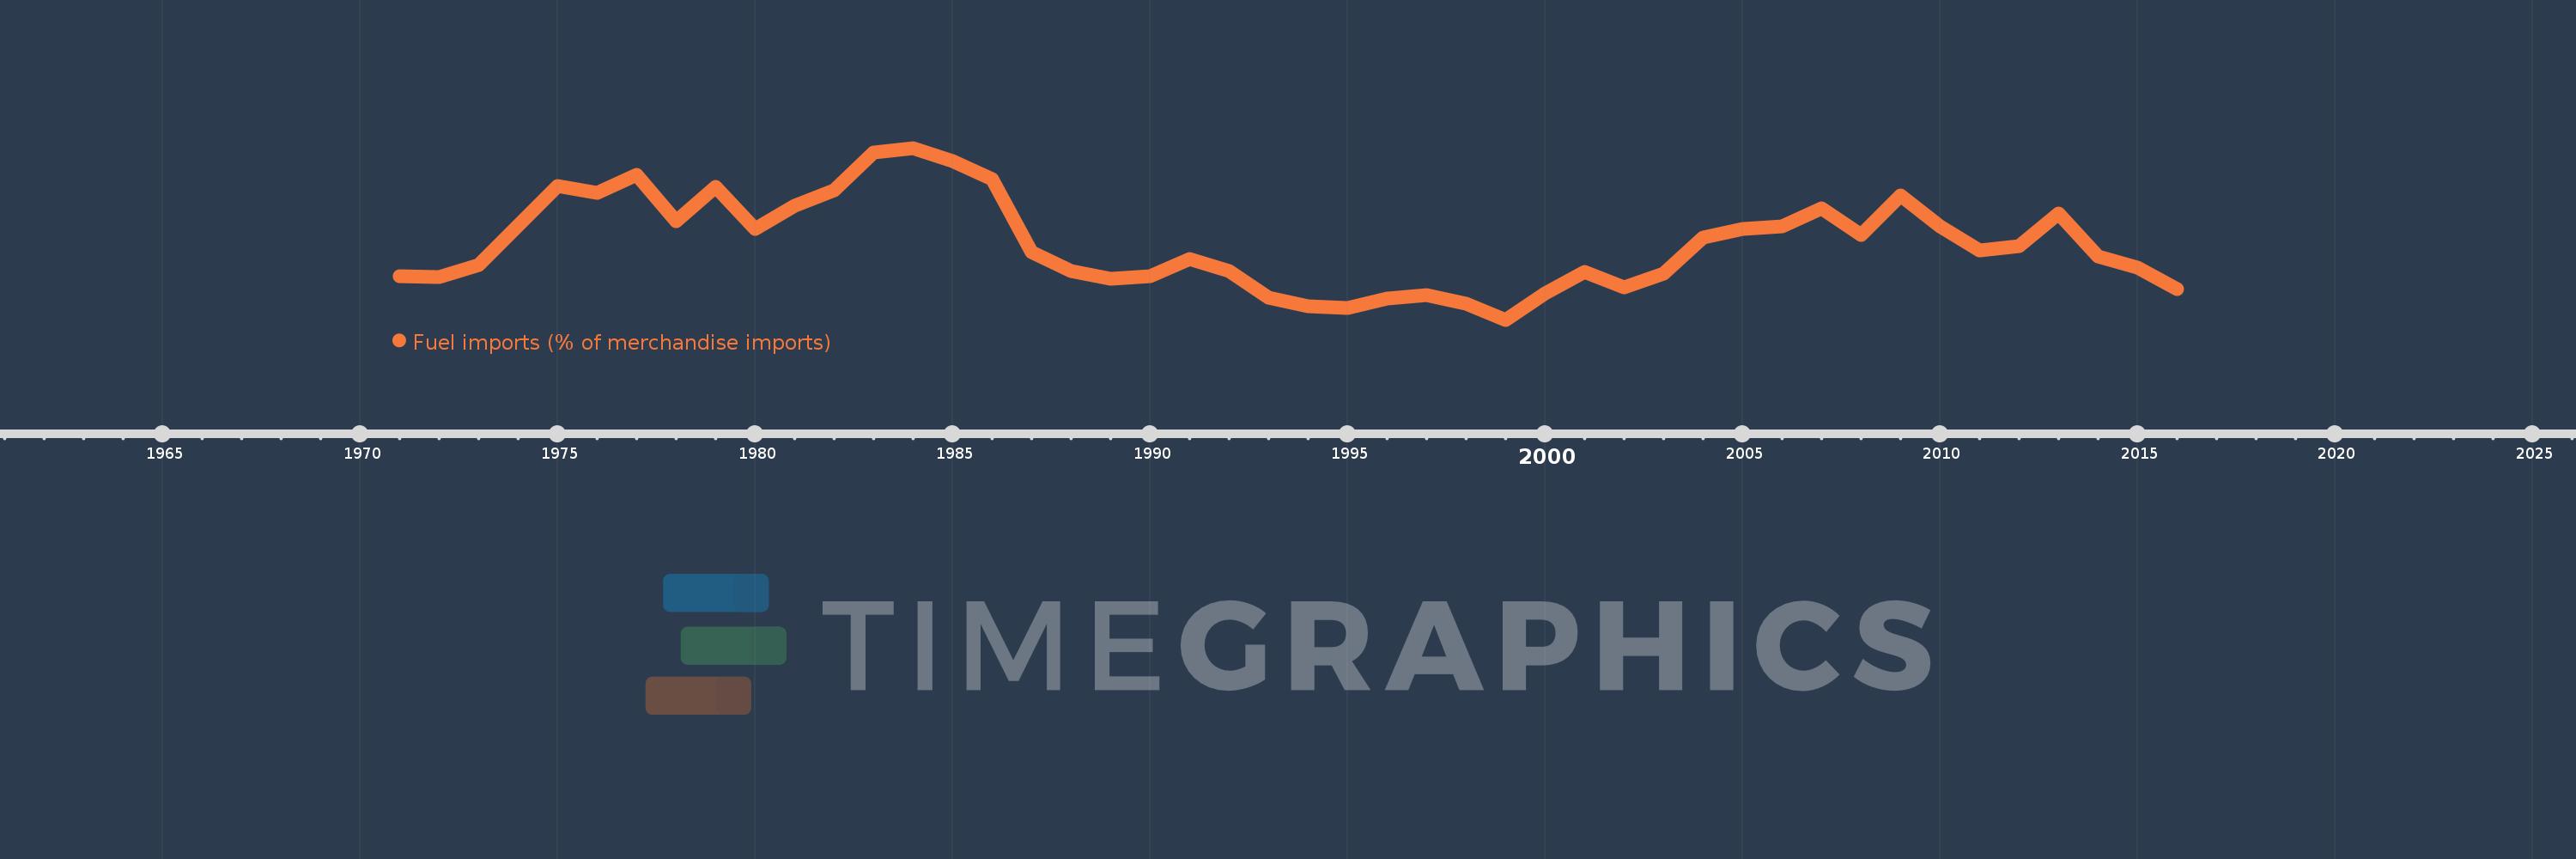
Fuel imports (% of merchandise imports)
2016,2015,2014,2013,2012,2011,2010,2009,2008,2007,2006,2005,2004,2003,2002,2001,2000,1999,1998,1997,1996,1995,1994,1993,1992,1991,1990,1989,1988,1987,1986,1985,1984,1983,1982,1981,1980,1979,1978,1977,1976,1975,1973,1972,1971
This statistics in other country:
AfghanistanAlbaniaAlgeriaAndorraAngolaAntigua and BarbudaArab WorldArgentinaArmeniaArubaAustraliaAustriaAzerbaijanBahamas, TheBahrainBangladeshBarbadosBelarusBelgiumBelizeBeninBermudaBhutanBoliviaBosnia and HerzegovinaBotswanaBrazilBrunei DarussalamBulgariaBurkina FasoBurundiCabo VerdeCambodiaCameroonCanadaCaribbean small statesCayman IslandsCentral African RepublicCentral Europe and the BalticsChadChileChinaColombiaComorosCongo, Dem. Rep.Congo, Rep.Costa RicaCote d'IvoireCroatiaCubaCyprusCzech RepublicDenmarkDjiboutiDominicaDominican RepublicEarly-demographic dividendEast Asia & PacificEast Asia & Pacific (excluding high income)East Asia & Pacific (IDA & IBRD countries)EcuadorEgypt, Arab Rep.El SalvadorEquatorial GuineaEritreaEstoniaEthiopiaEuro areaEurope & Central AsiaEurope & Central Asia (excluding high income)Europe & Central Asia (IDA & IBRD countries)European UnionFaroe IslandsFijiFinlandFragile and conflict affected situationsFranceFrench PolynesiaGabonGambia, TheGeorgiaGermanyGhanaGreeceGreenlandGrenadaGuatemalaGuineaGuinea-BissauGuyanaHaitiHeavily indebted poor countries (HIPC)High incomeHondurasHong Kong SAR, ChinaHungaryIBRD onlyIcelandIDA & IBRD totalIDA blendIDA onlyIDA totalIndiaIndonesiaIran, Islamic Rep.IraqIrelandIsraelItalyJamaicaJapanJordanKazakhstanKenyaKiribatiKorea, Rep.KuwaitKyrgyz RepublicLao PDRLate-demographic dividendLatin America & Caribbean Latin America & Caribbean (excluding high income)Latin America & the Caribbean (IDA & IBRD countries)LatviaLeast developed countries: UN classificationLebanonLesothoLiberiaLibyaLithuaniaLow & middle incomeLow incomeLower middle incomeLuxembourgMacao SAR, ChinaMacedonia, FYRMadagascarMalawiMalaysiaMaldivesMaliMaltaMauritaniaMauritiusMexicoMiddle East & North AfricaMiddle East & North Africa (excluding high income)Middle East & North Africa (IDA & IBRD countries)Middle incomeMoldovaMongoliaMoroccoMozambiqueMyanmarNamibiaNepalNetherlandsNew CaledoniaNew ZealandNicaraguaNigerNigeriaNorth AmericaNorwayOECD membersOmanOther small statesPacific island small statesPakistanPalauPanamaPapua New GuineaParaguayPeruPhilippinesPolandPortugalPost-demographic dividendPre-demographic dividendQatarRomaniaRussian FederationRwandaSamoaSao Tome and PrincipeSaudi ArabiaSenegalSerbiaSeychellesSierra LeoneSingaporeSlovak RepublicSloveniaSmall statesSolomon IslandsSomaliaSouth AfricaSouth AsiaSouth Asia (IDA & IBRD)SpainSri LankaSt. Kitts and NevisSt. LuciaSt. Vincent and the GrenadinesSub-Saharan Africa Sub-Saharan Africa (excluding high income)Sub-Saharan Africa (IDA & IBRD countries)SudanSurinameSwazilandSwedenSwitzerlandSyrian Arab RepublicTajikistanTanzaniaThailandTimor-LesteTogoTongaTrinidad and TobagoTunisiaTurkeyTurkmenistanTurks and Caicos IslandsTuvaluUgandaUkraineUnited Arab EmiratesUnited KingdomUnited StatesUpper middle incomeUruguayVanuatuVenezuela, RBVietnamVirgin Islands (U.S.)WorldYemen, Rep.ZambiaZimbabwe Timeline:
This timeline shows a graph from 1971 to 2016 of Uruguay. No data until 1970. Number of actual observations by date: 45.
Source name:
World Development Indicators
Source organization:
World Bank staff estimates from the Comtrade database maintained by the United Nations Statistics Division.
Categories, topics:
Energy & Mining, Private Sector, Trade
Last updated:
apr 23, 2017
Indicators value changes by year
At the date of observation
Value
Absolute change
Change from previous value
jan 1, 1971
14.659
+14.659
0.0%
jan 1, 1972
14.427
-0.232
-1.58%
jan 1, 1973
16.902
+2.475
17.16%
jan 1, 1975
32.45
+15.548
91.99%
jan 1, 1976
31.206
-1.244
-3.83%
jan 1, 1977
34.706
+3.5
11.22%
jan 1, 1978
25.586
-9.12
-26.28%
jan 1, 1979
32.307
+6.721
26.27%
jan 1, 1980
24.061
-8.245
-25.52%
jan 1, 1981
28.641
+4.58
19.03%
jan 1, 1982
31.64
+2.998
10.47%
jan 1, 1983
39.149
+7.509
23.73%
jan 1, 1984
40.05
+0.902
2.3%
jan 1, 1985
37.427
-2.623
-6.55%
jan 1, 1986
33.852
-3.575
-9.55%
jan 1, 1987
19.396
-14.456
-42.7%
jan 1, 1988
15.647
-3.749
-19.33%
jan 1, 1989
14.12
-1.527
-9.76%
jan 1, 1990
14.561
+0.441
3.13%
jan 1, 1991
18.059
+3.498
24.02%
jan 1, 1992
15.657
-2.402
-13.3%
jan 1, 1993
10.425
-5.232
-33.41%
jan 1, 1994
8.662
-1.763
-16.91%
jan 1, 1995
8.33
-0.332
-3.83%
jan 1, 1996
10.151
+1.821
21.87%
jan 1, 1997
10.895
+0.744
7.33%
jan 1, 1998
9.154
-1.741
-15.98%
jan 1, 1999
5.968
-3.186
-34.8%
jan 1, 2000
11.256
+5.288
88.6%
jan 1, 2001
15.428
+4.172
37.06%
jan 1, 2002
12.403
-3.024
-19.6%
jan 1, 2003
15.189
+2.785
22.46%
jan 1, 2004
22.194
+7.005
46.12%
jan 1, 2005
23.908
+1.714
7.72%
jan 1, 2006
24.425
+0.517
2.16%
jan 1, 2007
28.08
+3.655
14.96%
jan 1, 2008
22.755
-5.325
-18.96%
jan 1, 2009
30.595
+7.84
34.45%
jan 1, 2010
24.458
-6.136
-20.06%
jan 1, 2011
19.799
-4.659
-19.05%
jan 1, 2012
20.553
+0.754
3.81%
jan 1, 2013
27.03
+6.477
31.51%
jan 1, 2014
18.521
-8.509
-31.48%
jan 1, 2015
16.371
-2.15
-11.61%
jan 1, 2016
11.974
-4.397
-26.86%
Ranking of countries by current statistics by years


Comments: