29
/
en
AIzaSyAYiBZKx7MnpbEhh9jyipgxe19OcubqV5w
April 1, 2024
113575
Cote d'Ivoire
CIV
true
2
1
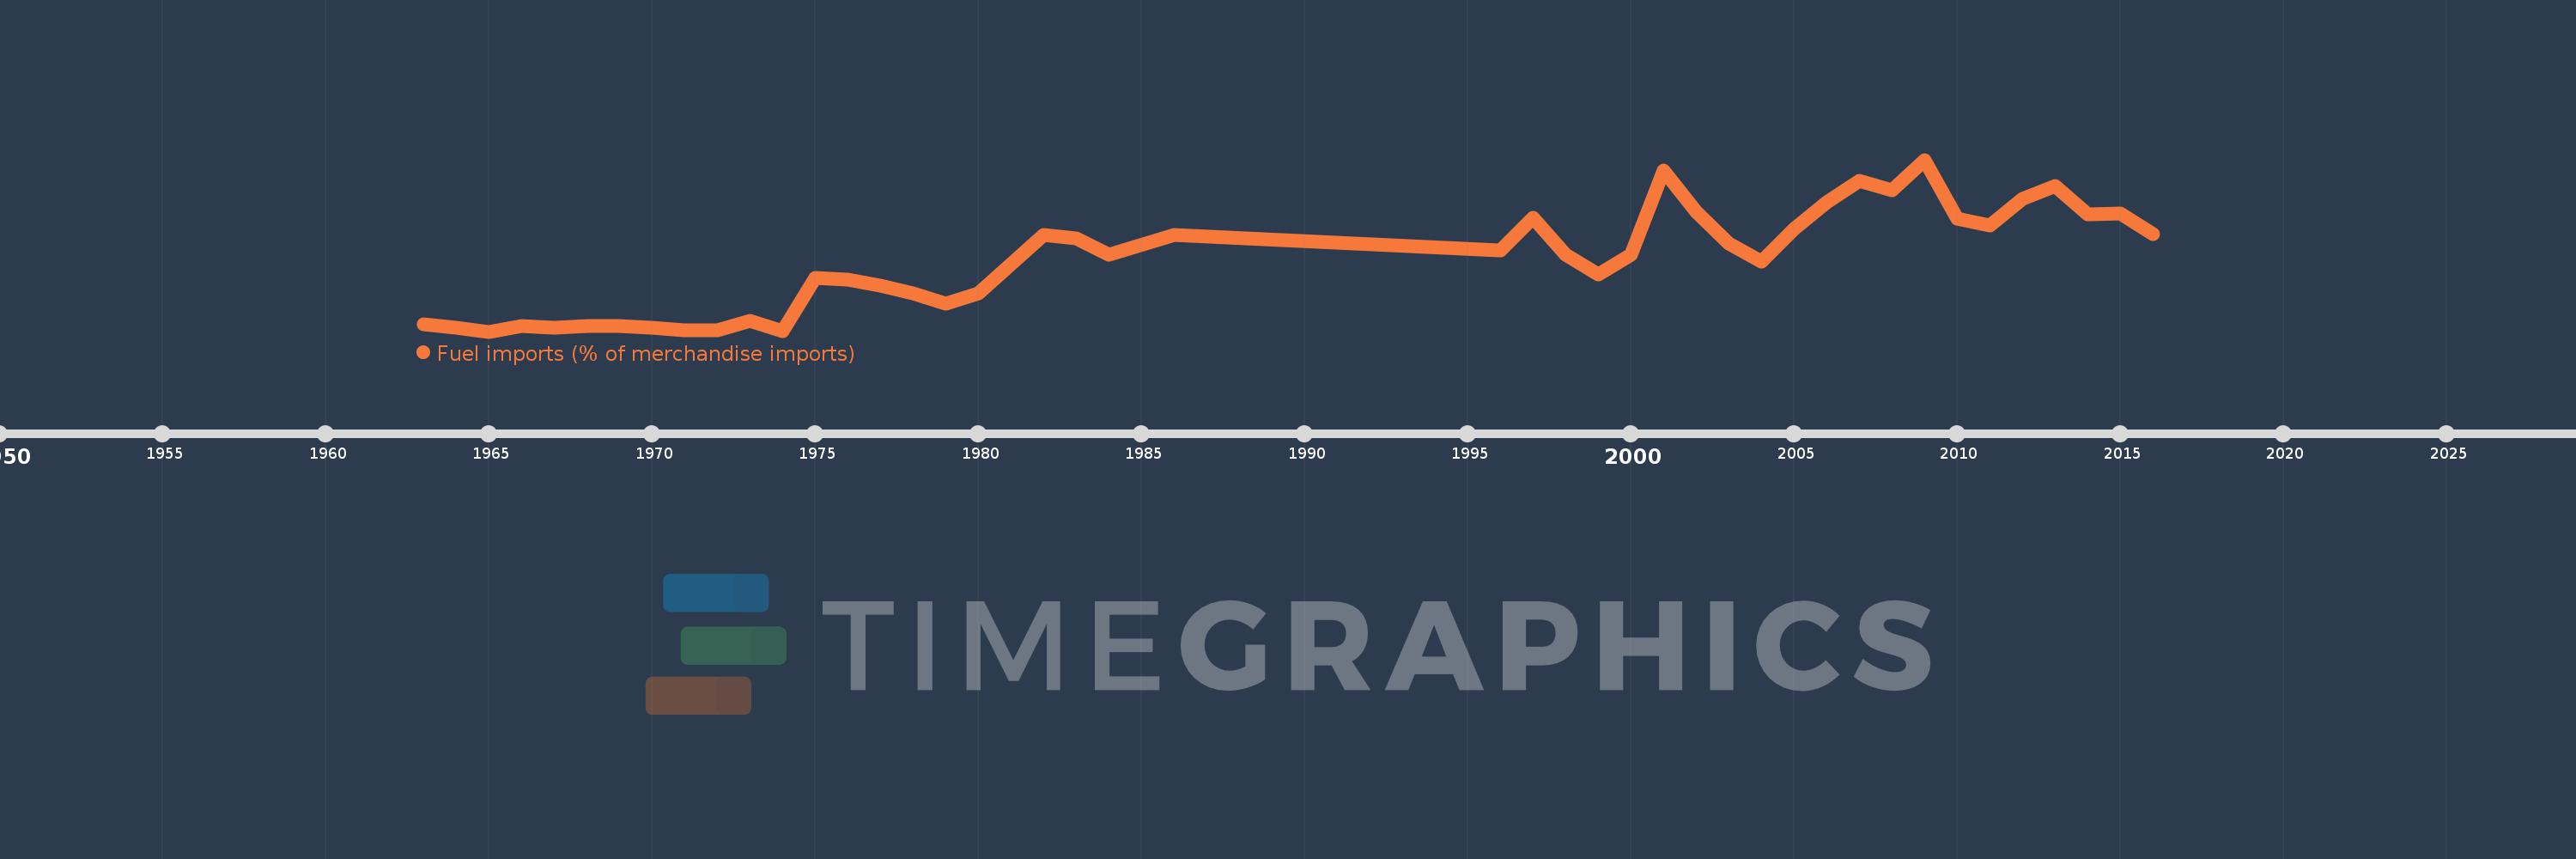
Fuel imports (% of merchandise imports)
2016,2015,2014,2013,2012,2011,2010,2009,2008,2007,2006,2005,2004,2003,2002,2001,2000,1999,1998,1997,1996,1986,1984,1983,1982,1980,1979,1978,1977,1976,1975,1974,1973,1972,1971,1970,1969,1968,1967,1966,1965,1964,1963
This statistics in other country:
AfghanistanAlbaniaAlgeriaAndorraAngolaAntigua and BarbudaArab WorldArgentinaArmeniaArubaAustraliaAustriaAzerbaijanBahamas, TheBahrainBangladeshBarbadosBelarusBelgiumBelizeBeninBermudaBhutanBoliviaBosnia and HerzegovinaBotswanaBrazilBrunei DarussalamBulgariaBurkina FasoBurundiCabo VerdeCambodiaCameroonCanadaCaribbean small statesCayman IslandsCentral African RepublicCentral Europe and the BalticsChadChileChinaColombiaComorosCongo, Dem. Rep.Congo, Rep.Costa RicaCote d'IvoireCroatiaCubaCyprusCzech RepublicDenmarkDjiboutiDominicaDominican RepublicEarly-demographic dividendEast Asia & PacificEast Asia & Pacific (excluding high income)East Asia & Pacific (IDA & IBRD countries)EcuadorEgypt, Arab Rep.El SalvadorEquatorial GuineaEritreaEstoniaEthiopiaEuro areaEurope & Central AsiaEurope & Central Asia (excluding high income)Europe & Central Asia (IDA & IBRD countries)European UnionFaroe IslandsFijiFinlandFragile and conflict affected situationsFranceFrench PolynesiaGabonGambia, TheGeorgiaGermanyGhanaGreeceGreenlandGrenadaGuatemalaGuineaGuinea-BissauGuyanaHaitiHeavily indebted poor countries (HIPC)High incomeHondurasHong Kong SAR, ChinaHungaryIBRD onlyIcelandIDA & IBRD totalIDA blendIDA onlyIDA totalIndiaIndonesiaIran, Islamic Rep.IraqIrelandIsraelItalyJamaicaJapanJordanKazakhstanKenyaKiribatiKorea, Rep.KuwaitKyrgyz RepublicLao PDRLate-demographic dividendLatin America & Caribbean Latin America & Caribbean (excluding high income)Latin America & the Caribbean (IDA & IBRD countries)LatviaLeast developed countries: UN classificationLebanonLesothoLiberiaLibyaLithuaniaLow & middle incomeLow incomeLower middle incomeLuxembourgMacao SAR, ChinaMacedonia, FYRMadagascarMalawiMalaysiaMaldivesMaliMaltaMauritaniaMauritiusMexicoMiddle East & North AfricaMiddle East & North Africa (excluding high income)Middle East & North Africa (IDA & IBRD countries)Middle incomeMoldovaMongoliaMoroccoMozambiqueMyanmarNamibiaNepalNetherlandsNew CaledoniaNew ZealandNicaraguaNigerNigeriaNorth AmericaNorwayOECD membersOmanOther small statesPacific island small statesPakistanPalauPanamaPapua New GuineaParaguayPeruPhilippinesPolandPortugalPost-demographic dividendPre-demographic dividendQatarRomaniaRussian FederationRwandaSamoaSao Tome and PrincipeSaudi ArabiaSenegalSerbiaSeychellesSierra LeoneSingaporeSlovak RepublicSloveniaSmall statesSolomon IslandsSomaliaSouth AfricaSouth AsiaSouth Asia (IDA & IBRD)SpainSri LankaSt. Kitts and NevisSt. LuciaSt. Vincent and the GrenadinesSub-Saharan Africa Sub-Saharan Africa (excluding high income)Sub-Saharan Africa (IDA & IBRD countries)SudanSurinameSwazilandSwedenSwitzerlandSyrian Arab RepublicTajikistanTanzaniaThailandTimor-LesteTogoTongaTrinidad and TobagoTunisiaTurkeyTurkmenistanTurks and Caicos IslandsTuvaluUgandaUkraineUnited Arab EmiratesUnited KingdomUnited StatesUpper middle incomeUruguayVanuatuVenezuela, RBVietnamVirgin Islands (U.S.)WorldYemen, Rep.ZambiaZimbabwe Timeline:
This timeline shows a graph from 1963 to 2016 of Cote d'Ivoire. No data until 1962. Number of actual observations by date: 43.
Source name:
World Development Indicators
Source organization:
World Bank staff estimates from the Comtrade database maintained by the United Nations Statistics Division.
Categories, topics:
Energy & Mining, Private Sector, Trade
Last updated:
apr 23, 2017
Indicators value changes by year
Maximum:
35.712
jan 1, 2009
At the date of observation
Value
Absolute change
Change from previous value
jan 1, 1963
5.813
+5.813
0.0%
jan 1, 1964
5.149
-0.665
-11.43%
jan 1, 1965
4.505
-0.643
-12.5%
jan 1, 1966
5.571
+1.066
23.67%
jan 1, 1967
5.275
-0.296
-5.32%
jan 1, 1968
5.468
+0.193
3.66%
jan 1, 1969
5.463
-0.005
-0.09%
jan 1, 1970
5.217
-0.246
-4.5%
jan 1, 1971
4.764
-0.452
-8.67%
jan 1, 1972
4.798
+0.034
0.71%
jan 1, 1973
6.407
+1.609
33.53%
jan 1, 1974
4.644
-1.763
-27.52%
jan 1, 1975
14.234
+9.59
206.53%
jan 1, 1976
13.903
-0.331
-2.32%
jan 1, 1977
12.847
-1.056
-7.6%
jan 1, 1978
11.416
-1.431
-11.14%
jan 1, 1979
9.582
-1.834
-16.07%
jan 1, 1980
11.416
+1.834
19.15%
jan 1, 1982
22.042
+10.626
93.08%
jan 1, 1983
21.479
-0.563
-2.55%
jan 1, 1984
18.548
-2.932
-13.65%
jan 1, 1986
21.993
+3.446
18.58%
jan 1, 1996
19.18
-2.813
-12.79%
jan 1, 1997
25.222
+6.042
31.5%
jan 1, 1998
18.422
-6.8
-26.96%
jan 1, 1999
14.86
-3.562
-19.34%
jan 1, 2000
18.488
+3.628
24.42%
jan 1, 2001
33.745
+15.257
82.52%
jan 1, 2002
26.292
-7.453
-22.09%
jan 1, 2003
20.545
-5.747
-21.86%
jan 1, 2004
17.287
-3.258
-15.86%
jan 1, 2005
23.194
+5.907
34.17%
jan 1, 2006
28.026
+4.832
20.83%
jan 1, 2007
31.815
+3.789
13.52%
jan 1, 2008
30.161
-1.655
-5.2%
jan 1, 2009
35.712
+5.551
18.41%
jan 1, 2010
25.008
-10.704
-29.97%
jan 1, 2011
23.715
-1.293
-5.17%
jan 1, 2012
28.635
+4.919
20.74%
jan 1, 2013
30.971
+2.337
8.16%
jan 1, 2014
25.764
-5.208
-16.81%
jan 1, 2015
25.899
+0.135
0.52%
jan 1, 2016
22.256
-3.643
-14.06%
Ranking of countries by current statistics by years


Comments: