29
/
en
AIzaSyAYiBZKx7MnpbEhh9jyipgxe19OcubqV5w
April 1, 2024
102428
Central African Republic
CAF
true
2
1
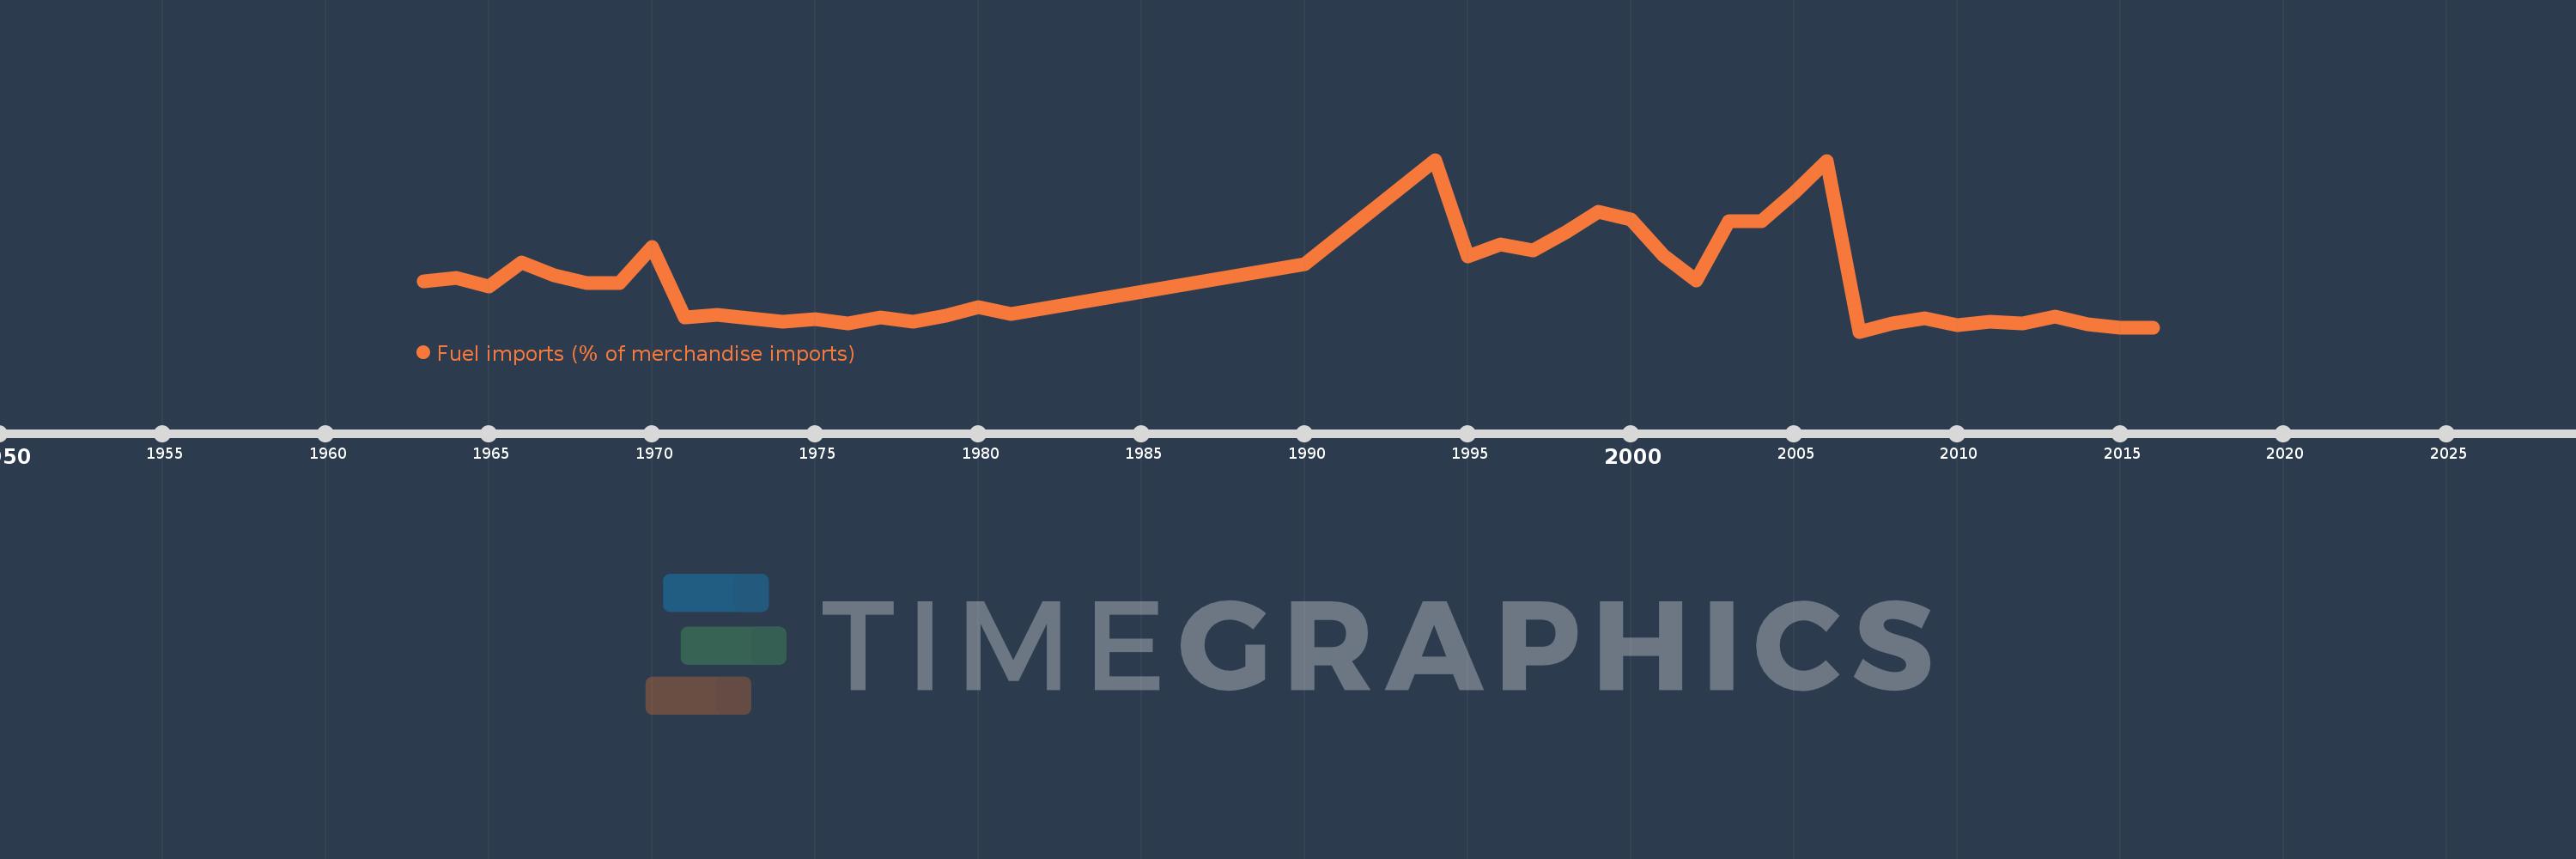
Fuel imports (% of merchandise imports)
2016,2015,2014,2013,2012,2011,2010,2009,2008,2007,2006,2005,2004,2003,2002,2001,2000,1999,1998,1997,1996,1995,1994,1990,1981,1980,1979,1978,1977,1976,1975,1974,1972,1971,1970,1969,1968,1967,1966,1965,1964,1963
This statistics in other country:
AfghanistanAlbaniaAlgeriaAndorraAngolaAntigua and BarbudaArab WorldArgentinaArmeniaArubaAustraliaAustriaAzerbaijanBahamas, TheBahrainBangladeshBarbadosBelarusBelgiumBelizeBeninBermudaBhutanBoliviaBosnia and HerzegovinaBotswanaBrazilBrunei DarussalamBulgariaBurkina FasoBurundiCabo VerdeCambodiaCameroonCanadaCaribbean small statesCayman IslandsCentral African RepublicCentral Europe and the BalticsChadChileChinaColombiaComorosCongo, Dem. Rep.Congo, Rep.Costa RicaCote d'IvoireCroatiaCubaCyprusCzech RepublicDenmarkDjiboutiDominicaDominican RepublicEarly-demographic dividendEast Asia & PacificEast Asia & Pacific (excluding high income)East Asia & Pacific (IDA & IBRD countries)EcuadorEgypt, Arab Rep.El SalvadorEquatorial GuineaEritreaEstoniaEthiopiaEuro areaEurope & Central AsiaEurope & Central Asia (excluding high income)Europe & Central Asia (IDA & IBRD countries)European UnionFaroe IslandsFijiFinlandFragile and conflict affected situationsFranceFrench PolynesiaGabonGambia, TheGeorgiaGermanyGhanaGreeceGreenlandGrenadaGuatemalaGuineaGuinea-BissauGuyanaHaitiHeavily indebted poor countries (HIPC)High incomeHondurasHong Kong SAR, ChinaHungaryIBRD onlyIcelandIDA & IBRD totalIDA blendIDA onlyIDA totalIndiaIndonesiaIran, Islamic Rep.IraqIrelandIsraelItalyJamaicaJapanJordanKazakhstanKenyaKiribatiKorea, Rep.KuwaitKyrgyz RepublicLao PDRLate-demographic dividendLatin America & Caribbean Latin America & Caribbean (excluding high income)Latin America & the Caribbean (IDA & IBRD countries)LatviaLeast developed countries: UN classificationLebanonLesothoLiberiaLibyaLithuaniaLow & middle incomeLow incomeLower middle incomeLuxembourgMacao SAR, ChinaMacedonia, FYRMadagascarMalawiMalaysiaMaldivesMaliMaltaMauritaniaMauritiusMexicoMiddle East & North AfricaMiddle East & North Africa (excluding high income)Middle East & North Africa (IDA & IBRD countries)Middle incomeMoldovaMongoliaMoroccoMozambiqueMyanmarNamibiaNepalNetherlandsNew CaledoniaNew ZealandNicaraguaNigerNigeriaNorth AmericaNorwayOECD membersOmanOther small statesPacific island small statesPakistanPalauPanamaPapua New GuineaParaguayPeruPhilippinesPolandPortugalPost-demographic dividendPre-demographic dividendQatarRomaniaRussian FederationRwandaSamoaSao Tome and PrincipeSaudi ArabiaSenegalSerbiaSeychellesSierra LeoneSingaporeSlovak RepublicSloveniaSmall statesSolomon IslandsSomaliaSouth AfricaSouth AsiaSouth Asia (IDA & IBRD)SpainSri LankaSt. Kitts and NevisSt. LuciaSt. Vincent and the GrenadinesSub-Saharan Africa Sub-Saharan Africa (excluding high income)Sub-Saharan Africa (IDA & IBRD countries)SudanSurinameSwazilandSwedenSwitzerlandSyrian Arab RepublicTajikistanTanzaniaThailandTimor-LesteTogoTongaTrinidad and TobagoTunisiaTurkeyTurkmenistanTurks and Caicos IslandsTuvaluUgandaUkraineUnited Arab EmiratesUnited KingdomUnited StatesUpper middle incomeUruguayVanuatuVenezuela, RBVietnamVirgin Islands (U.S.)WorldYemen, Rep.ZambiaZimbabwe Timeline:
This timeline shows a graph from 1963 to 2016 of Central African Republic. No data until 1962. Number of actual observations by date: 42.
Source name:
World Development Indicators
Source organization:
World Bank staff estimates from the Comtrade database maintained by the United Nations Statistics Division.
Categories, topics:
Energy & Mining, Private Sector, Trade
Last updated:
apr 23, 2017
Indicators value changes by year
At the date of observation
Value
Absolute change
Change from previous value
jan 1, 1963
4.986
+4.986
0.0%
jan 1, 1964
5.318
+0.333
6.68%
jan 1, 1965
4.5
-0.818
-15.39%
jan 1, 1966
6.928
+2.428
53.96%
jan 1, 1967
5.605
-1.324
-19.11%
jan 1, 1968
4.83
-0.774
-13.81%
jan 1, 1969
4.845
+0.014
0.3%
jan 1, 1970
8.406
+3.562
73.52%
jan 1, 1971
1.382
-7.024
-83.56%
jan 1, 1972
1.665
+0.283
20.51%
jan 1, 1974
0.957
-0.709
-42.56%
jan 1, 1975
1.289
+0.332
34.73%
jan 1, 1976
0.823
-0.466
-36.18%
jan 1, 1977
1.426
+0.603
73.33%
jan 1, 1978
0.968
-0.457
-32.08%
jan 1, 1979
1.586
+0.617
63.74%
jan 1, 1980
2.43
+0.844
53.26%
jan 1, 1981
1.769
-0.661
-27.19%
jan 1, 1990
6.696
+4.926
278.45%
jan 1, 1994
17.1
+10.404
155.39%
jan 1, 1995
7.46
-9.64
-56.37%
jan 1, 1996
8.687
+1.227
16.44%
jan 1, 1997
8.11
-0.576
-6.64%
jan 1, 1998
9.872
+1.762
21.73%
jan 1, 1999
11.971
+2.099
21.26%
jan 1, 2000
11.119
-0.853
-7.12%
jan 1, 2001
7.545
-3.573
-32.14%
jan 1, 2002
5.084
-2.461
-32.62%
jan 1, 2003
10.959
+5.876
115.57%
jan 1, 2004
11.029
+0.069
0.63%
jan 1, 2005
13.82
+2.791
25.31%
jan 1, 2006
16.941
+3.121
22.58%
jan 1, 2007
0.01
-16.931
-99.94%
jan 1, 2008
0.856
+0.845
8.05K%
jan 1, 2009
1.347
+0.491
57.38%
jan 1, 2010
0.628
-0.719
-53.35%
jan 1, 2011
1.035
+0.407
64.69%
jan 1, 2012
0.841
-0.194
-18.73%
jan 1, 2013
1.532
+0.691
82.11%
jan 1, 2014
0.719
-0.812
-53.04%
jan 1, 2015
0.428
-0.291
-40.51%
jan 1, 2016
0.431
+0.003
0.81%
Ranking of countries by current statistics by years


Comments: