29
/
en
AIzaSyAYiBZKx7MnpbEhh9jyipgxe19OcubqV5w
April 1, 2024
275680
United Kingdom
GBR
true
2
1
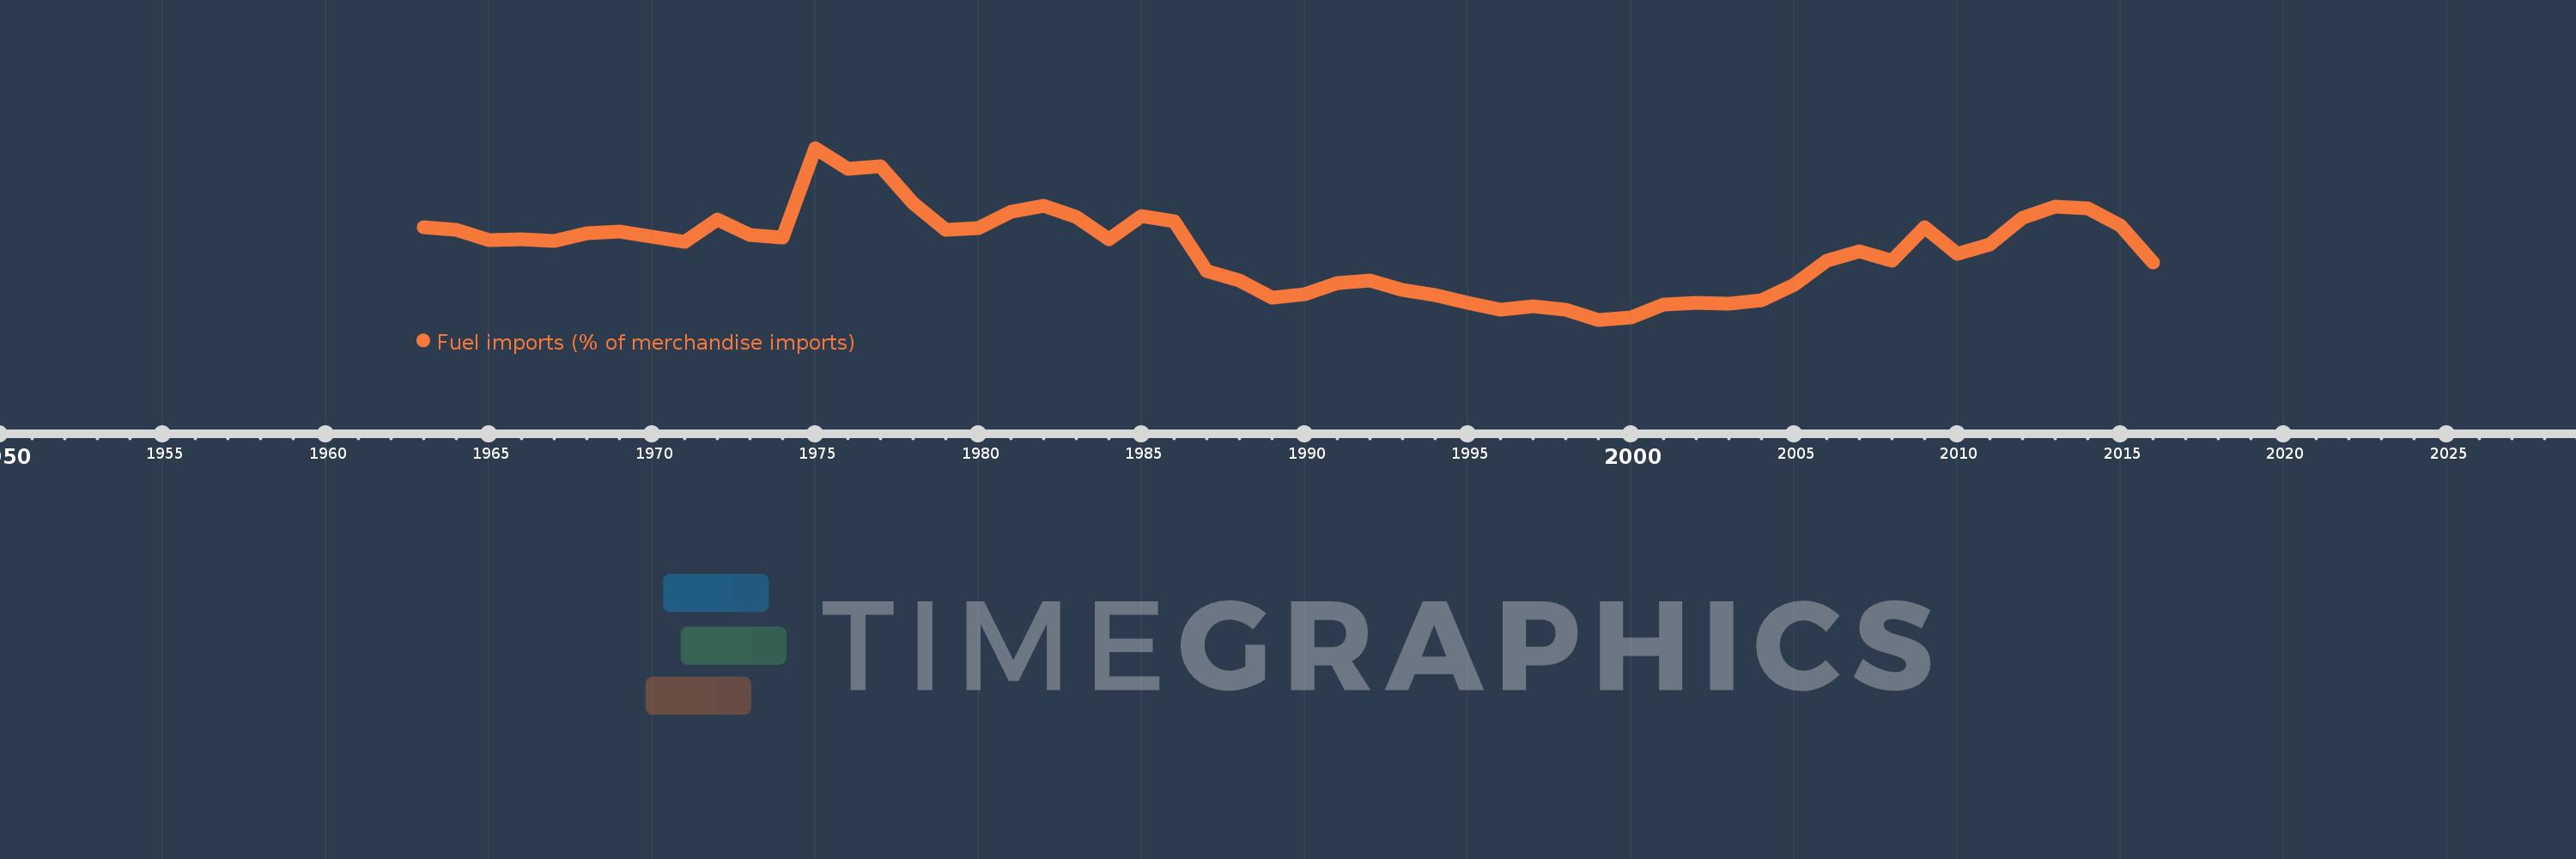
Fuel imports (% of merchandise imports)
2016,2015,2014,2013,2012,2011,2010,2009,2008,2007,2006,2005,2004,2003,2002,2001,2000,1999,1998,1997,1996,1995,1994,1993,1992,1991,1990,1989,1988,1987,1986,1985,1984,1983,1982,1981,1980,1979,1978,1977,1976,1975,1974,1973,1972,1971,1970,1969,1968,1967,1966,1965,1964,1963
This statistics in other country:
AfghanistanAlbaniaAlgeriaAndorraAngolaAntigua and BarbudaArab WorldArgentinaArmeniaArubaAustraliaAustriaAzerbaijanBahamas, TheBahrainBangladeshBarbadosBelarusBelgiumBelizeBeninBermudaBhutanBoliviaBosnia and HerzegovinaBotswanaBrazilBrunei DarussalamBulgariaBurkina FasoBurundiCabo VerdeCambodiaCameroonCanadaCaribbean small statesCayman IslandsCentral African RepublicCentral Europe and the BalticsChadChileChinaColombiaComorosCongo, Dem. Rep.Congo, Rep.Costa RicaCote d'IvoireCroatiaCubaCyprusCzech RepublicDenmarkDjiboutiDominicaDominican RepublicEarly-demographic dividendEast Asia & PacificEast Asia & Pacific (excluding high income)East Asia & Pacific (IDA & IBRD countries)EcuadorEgypt, Arab Rep.El SalvadorEquatorial GuineaEritreaEstoniaEthiopiaEuro areaEurope & Central AsiaEurope & Central Asia (excluding high income)Europe & Central Asia (IDA & IBRD countries)European UnionFaroe IslandsFijiFinlandFragile and conflict affected situationsFranceFrench PolynesiaGabonGambia, TheGeorgiaGermanyGhanaGreeceGreenlandGrenadaGuatemalaGuineaGuinea-BissauGuyanaHaitiHeavily indebted poor countries (HIPC)High incomeHondurasHong Kong SAR, ChinaHungaryIBRD onlyIcelandIDA & IBRD totalIDA blendIDA onlyIDA totalIndiaIndonesiaIran, Islamic Rep.IraqIrelandIsraelItalyJamaicaJapanJordanKazakhstanKenyaKiribatiKorea, Rep.KuwaitKyrgyz RepublicLao PDRLate-demographic dividendLatin America & Caribbean Latin America & Caribbean (excluding high income)Latin America & the Caribbean (IDA & IBRD countries)LatviaLeast developed countries: UN classificationLebanonLesothoLiberiaLibyaLithuaniaLow & middle incomeLow incomeLower middle incomeLuxembourgMacao SAR, ChinaMacedonia, FYRMadagascarMalawiMalaysiaMaldivesMaliMaltaMauritaniaMauritiusMexicoMiddle East & North AfricaMiddle East & North Africa (excluding high income)Middle East & North Africa (IDA & IBRD countries)Middle incomeMoldovaMongoliaMoroccoMozambiqueMyanmarNamibiaNepalNetherlandsNew CaledoniaNew ZealandNicaraguaNigerNigeriaNorth AmericaNorwayOECD membersOmanOther small statesPacific island small statesPakistanPalauPanamaPapua New GuineaParaguayPeruPhilippinesPolandPortugalPost-demographic dividendPre-demographic dividendQatarRomaniaRussian FederationRwandaSamoaSao Tome and PrincipeSaudi ArabiaSenegalSerbiaSeychellesSierra LeoneSingaporeSlovak RepublicSloveniaSmall statesSolomon IslandsSomaliaSouth AfricaSouth AsiaSouth Asia (IDA & IBRD)SpainSri LankaSt. Kitts and NevisSt. LuciaSt. Vincent and the GrenadinesSub-Saharan Africa Sub-Saharan Africa (excluding high income)Sub-Saharan Africa (IDA & IBRD countries)SudanSurinameSwazilandSwedenSwitzerlandSyrian Arab RepublicTajikistanTanzaniaThailandTimor-LesteTogoTongaTrinidad and TobagoTunisiaTurkeyTurkmenistanTurks and Caicos IslandsTuvaluUgandaUkraineUnited Arab EmiratesUnited KingdomUnited StatesUpper middle incomeUruguayVanuatuVenezuela, RBVietnamVirgin Islands (U.S.)WorldYemen, Rep.ZambiaZimbabwe Timeline:
This timeline shows a graph from 1963 to 2016 of United Kingdom. No data until 1962. Number of actual observations by date: 54.
Source name:
World Development Indicators
Source organization:
World Bank staff estimates from the Comtrade database maintained by the United Nations Statistics Division.
Categories, topics:
Energy & Mining, Private Sector, Trade
Last updated:
apr 23, 2017
Indicators value changes by year
At the date of observation
Value
Absolute change
Change from previous value
jan 1, 1963
11.889
+11.889
0.0%
jan 1, 1964
11.667
-0.221
-1.86%
jan 1, 1965
10.61
-1.057
-9.06%
jan 1, 1966
10.702
+0.092
0.87%
jan 1, 1967
10.531
-0.171
-1.6%
jan 1, 1968
11.353
+0.822
7.8%
jan 1, 1969
11.461
+0.108
0.95%
jan 1, 1970
10.947
-0.513
-4.48%
jan 1, 1971
10.448
-0.499
-4.56%
jan 1, 1972
12.705
+2.256
21.6%
jan 1, 1973
11.154
-1.551
-12.2%
jan 1, 1974
10.895
-0.259
-2.33%
jan 1, 1975
20.02
+9.125
83.76%
jan 1, 1976
17.925
-2.095
-10.47%
jan 1, 1977
18.118
+0.193
1.08%
jan 1, 1978
14.346
-3.772
-20.82%
jan 1, 1979
11.705
-2.641
-18.41%
jan 1, 1980
11.881
+0.175
1.5%
jan 1, 1981
13.468
+1.588
13.36%
jan 1, 1982
14.118
+0.649
4.82%
jan 1, 1983
12.998
-1.12
-7.93%
jan 1, 1984
10.735
-2.263
-17.41%
jan 1, 1985
13.055
+2.319
21.6%
jan 1, 1986
12.507
-0.548
-4.2%
jan 1, 1987
7.437
-5.07
-40.54%
jan 1, 1988
6.466
-0.97
-13.05%
jan 1, 1989
4.716
-1.751
-27.08%
jan 1, 1990
5.116
+0.4
8.49%
jan 1, 1991
6.222
+1.107
21.63%
jan 1, 1992
6.523
+0.301
4.84%
jan 1, 1993
5.555
-0.969
-14.85%
jan 1, 1994
4.981
-0.574
-10.33%
jan 1, 1995
4.201
-0.78
-15.66%
jan 1, 1996
3.545
-0.656
-15.61%
jan 1, 1997
3.88
+0.334
9.43%
jan 1, 1998
3.52
-0.36
-9.28%
jan 1, 1999
2.492
-1.027
-29.19%
jan 1, 2000
2.702
+0.209
8.39%
jan 1, 2001
4.077
+1.375
50.91%
jan 1, 2002
4.193
+0.116
2.85%
jan 1, 2003
4.117
-0.076
-1.82%
jan 1, 2004
4.45
+0.333
8.08%
jan 1, 2005
6.024
+1.574
35.38%
jan 1, 2006
8.512
+2.488
41.3%
jan 1, 2007
9.489
+0.978
11.48%
jan 1, 2008
8.552
-0.938
-9.88%
jan 1, 2009
11.964
+3.413
39.91%
jan 1, 2010
9.19
-2.775
-23.19%
jan 1, 2011
10.196
+1.007
10.95%
jan 1, 2012
12.893
+2.696
26.45%
jan 1, 2013
14.064
+1.171
9.08%
jan 1, 2014
13.854
-0.21
-1.49%
jan 1, 2015
12.126
-1.728
-12.47%
jan 1, 2016
8.35
-3.777
-31.14%
Ranking of countries by current statistics by years


Comments: