29
/
en
AIzaSyAYiBZKx7MnpbEhh9jyipgxe19OcubqV5w
April 1, 2024
169899
Korea, Rep.
KOR
true
2
1
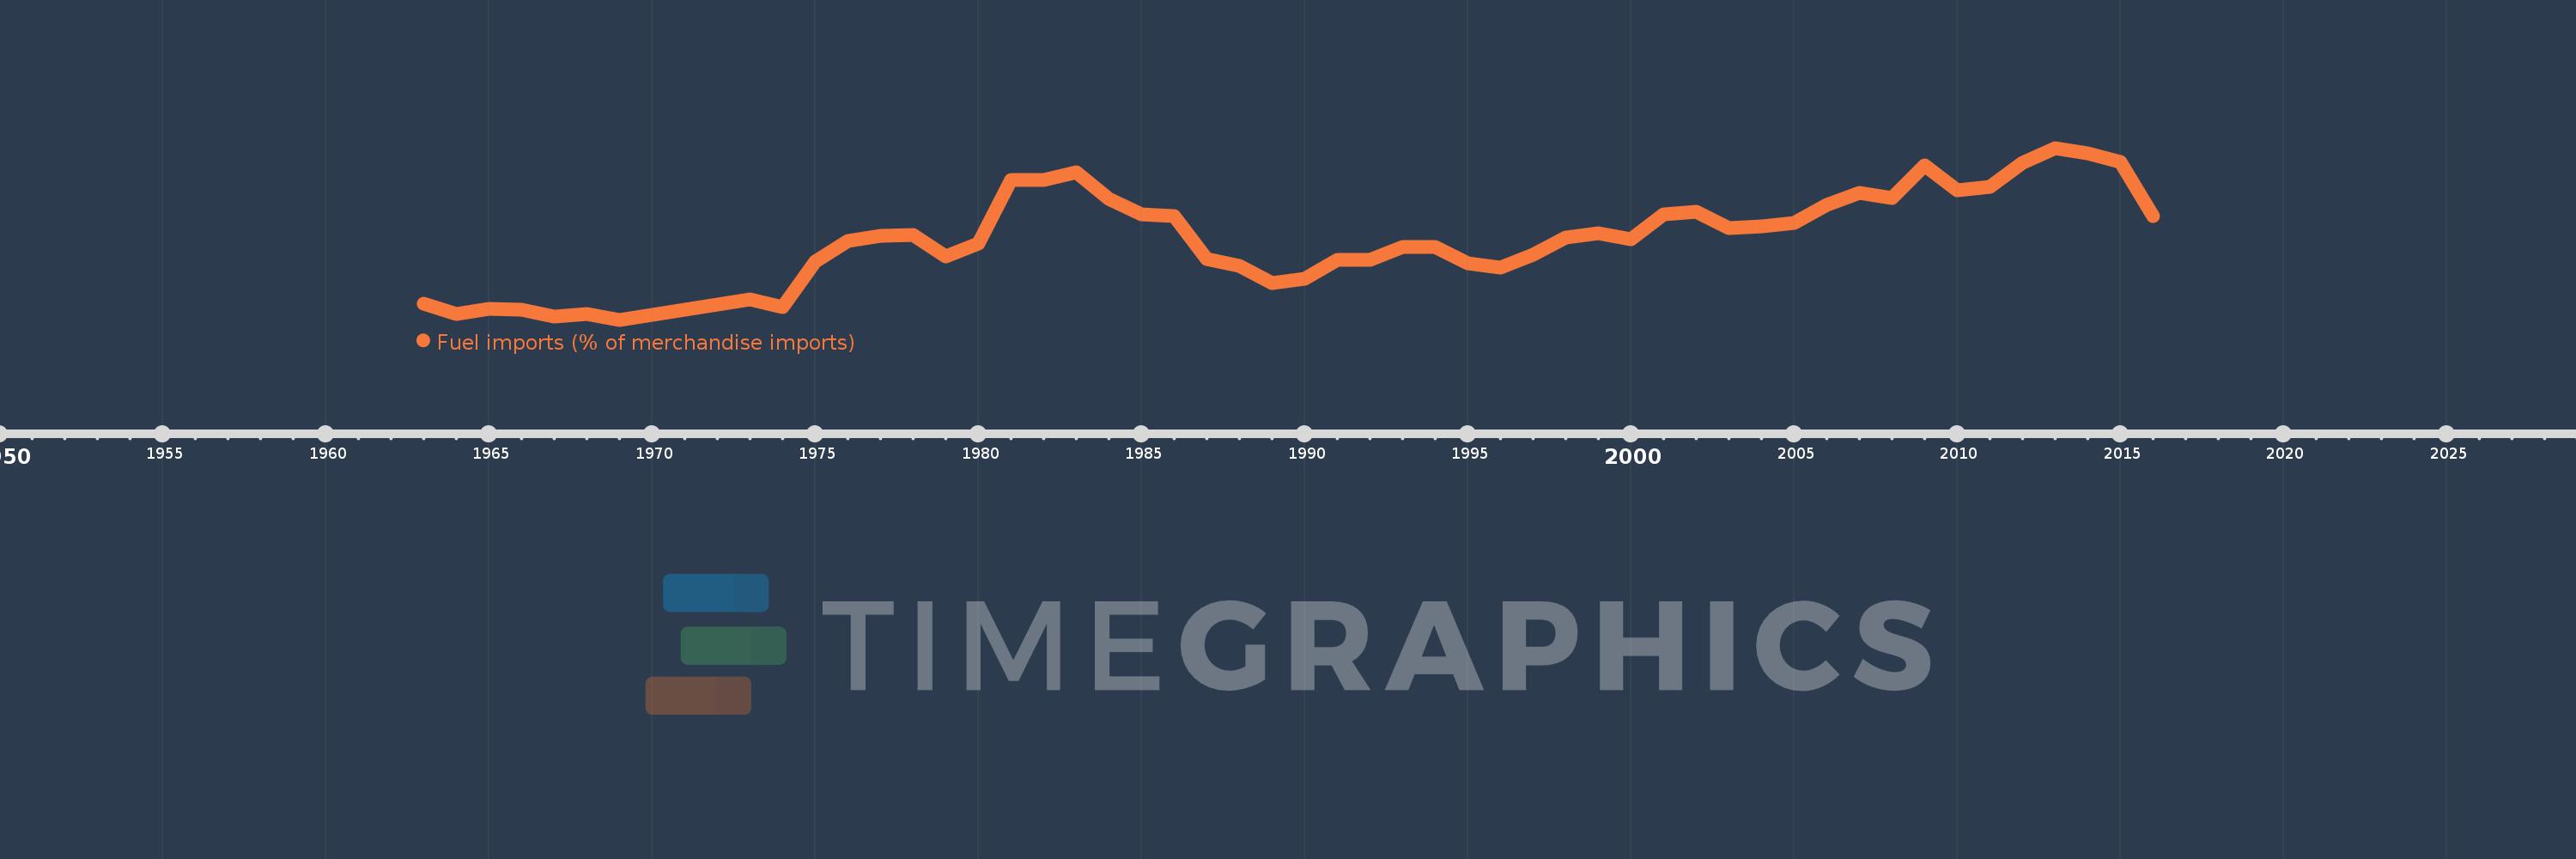
Fuel imports (% of merchandise imports)
2016,2015,2014,2013,2012,2011,2010,2009,2008,2007,2006,2005,2004,2003,2002,2001,2000,1999,1998,1997,1996,1995,1994,1993,1992,1991,1990,1989,1988,1987,1986,1985,1984,1983,1982,1981,1980,1979,1978,1977,1976,1975,1974,1973,1972,1971,1970,1969,1968,1967,1966,1965,1964,1963
This statistics in other country:
AfghanistanAlbaniaAlgeriaAndorraAngolaAntigua and BarbudaArab WorldArgentinaArmeniaArubaAustraliaAustriaAzerbaijanBahamas, TheBahrainBangladeshBarbadosBelarusBelgiumBelizeBeninBermudaBhutanBoliviaBosnia and HerzegovinaBotswanaBrazilBrunei DarussalamBulgariaBurkina FasoBurundiCabo VerdeCambodiaCameroonCanadaCaribbean small statesCayman IslandsCentral African RepublicCentral Europe and the BalticsChadChileChinaColombiaComorosCongo, Dem. Rep.Congo, Rep.Costa RicaCote d'IvoireCroatiaCubaCyprusCzech RepublicDenmarkDjiboutiDominicaDominican RepublicEarly-demographic dividendEast Asia & PacificEast Asia & Pacific (excluding high income)East Asia & Pacific (IDA & IBRD countries)EcuadorEgypt, Arab Rep.El SalvadorEquatorial GuineaEritreaEstoniaEthiopiaEuro areaEurope & Central AsiaEurope & Central Asia (excluding high income)Europe & Central Asia (IDA & IBRD countries)European UnionFaroe IslandsFijiFinlandFragile and conflict affected situationsFranceFrench PolynesiaGabonGambia, TheGeorgiaGermanyGhanaGreeceGreenlandGrenadaGuatemalaGuineaGuinea-BissauGuyanaHaitiHeavily indebted poor countries (HIPC)High incomeHondurasHong Kong SAR, ChinaHungaryIBRD onlyIcelandIDA & IBRD totalIDA blendIDA onlyIDA totalIndiaIndonesiaIran, Islamic Rep.IraqIrelandIsraelItalyJamaicaJapanJordanKazakhstanKenyaKiribatiKorea, Rep.KuwaitKyrgyz RepublicLao PDRLate-demographic dividendLatin America & Caribbean Latin America & Caribbean (excluding high income)Latin America & the Caribbean (IDA & IBRD countries)LatviaLeast developed countries: UN classificationLebanonLesothoLiberiaLibyaLithuaniaLow & middle incomeLow incomeLower middle incomeLuxembourgMacao SAR, ChinaMacedonia, FYRMadagascarMalawiMalaysiaMaldivesMaliMaltaMauritaniaMauritiusMexicoMiddle East & North AfricaMiddle East & North Africa (excluding high income)Middle East & North Africa (IDA & IBRD countries)Middle incomeMoldovaMongoliaMoroccoMozambiqueMyanmarNamibiaNepalNetherlandsNew CaledoniaNew ZealandNicaraguaNigerNigeriaNorth AmericaNorwayOECD membersOmanOther small statesPacific island small statesPakistanPalauPanamaPapua New GuineaParaguayPeruPhilippinesPolandPortugalPost-demographic dividendPre-demographic dividendQatarRomaniaRussian FederationRwandaSamoaSao Tome and PrincipeSaudi ArabiaSenegalSerbiaSeychellesSierra LeoneSingaporeSlovak RepublicSloveniaSmall statesSolomon IslandsSomaliaSouth AfricaSouth AsiaSouth Asia (IDA & IBRD)SpainSri LankaSt. Kitts and NevisSt. LuciaSt. Vincent and the GrenadinesSub-Saharan Africa Sub-Saharan Africa (excluding high income)Sub-Saharan Africa (IDA & IBRD countries)SudanSurinameSwazilandSwedenSwitzerlandSyrian Arab RepublicTajikistanTanzaniaThailandTimor-LesteTogoTongaTrinidad and TobagoTunisiaTurkeyTurkmenistanTurks and Caicos IslandsTuvaluUgandaUkraineUnited Arab EmiratesUnited KingdomUnited StatesUpper middle incomeUruguayVanuatuVenezuela, RBVietnamVirgin Islands (U.S.)WorldYemen, Rep.ZambiaZimbabwe Timeline:
This timeline shows a graph from 1963 to 2016 of Korea, Rep.. No data until 1962. Number of actual observations by date: 54.
Source name:
World Development Indicators
Source organization:
World Bank staff estimates from the Comtrade database maintained by the United Nations Statistics Division.
Categories, topics:
Energy & Mining, Private Sector, Trade
Last updated:
apr 23, 2017
Indicators value changes by year
Maximum:
35.581
jan 1, 2013
At the date of observation
Value
Absolute change
Change from previous value
jan 1, 1963
8.021
+8.021
0.0%
jan 1, 1964
6.136
-1.885
-23.5%
jan 1, 1965
7.041
+0.905
14.75%
jan 1, 1966
6.949
-0.092
-1.3%
jan 1, 1967
5.763
-1.187
-17.07%
jan 1, 1968
6.185
+0.422
7.32%
jan 1, 1969
5.146
-1.038
-16.79%
jan 1, 1970
6.083
+0.937
18.2%
jan 1, 1971
6.856
+0.773
12.7%
jan 1, 1972
7.91
+1.055
15.38%
jan 1, 1973
8.681
+0.771
9.75%
jan 1, 1974
7.37
-1.312
-15.11%
jan 1, 1975
15.407
+8.037
109.06%
jan 1, 1976
19.077
+3.67
23.82%
jan 1, 1977
19.938
+0.86
4.51%
jan 1, 1978
20.173
+0.236
1.18%
jan 1, 1979
16.391
-3.782
-18.75%
jan 1, 1980
18.618
+2.227
13.59%
jan 1, 1981
29.862
+11.244
60.39%
jan 1, 1982
29.831
-0.031
-0.1%
jan 1, 1983
31.327
+1.496
5.02%
jan 1, 1984
26.584
-4.743
-15.14%
jan 1, 1985
23.766
-2.819
-10.6%
jan 1, 1986
23.565
-0.201
-0.85%
jan 1, 1987
15.94
-7.625
-32.36%
jan 1, 1988
14.644
-1.296
-8.13%
jan 1, 1989
11.603
-3.041
-20.76%
jan 1, 1990
12.41
+0.807
6.95%
jan 1, 1991
15.81
+3.4
27.4%
jan 1, 1992
15.702
-0.108
-0.68%
jan 1, 1993
18.0
+2.298
14.64%
jan 1, 1994
18.053
+0.053
0.29%
jan 1, 1995
15.152
-2.902
-16.07%
jan 1, 1996
14.335
-0.816
-5.39%
jan 1, 1997
16.709
+2.373
16.56%
jan 1, 1998
19.705
+2.997
17.94%
jan 1, 1999
20.464
+0.758
3.85%
jan 1, 2000
19.463
-1.001
-4.89%
jan 1, 2001
23.891
+4.428
22.75%
jan 1, 2002
24.23
+0.34
1.42%
jan 1, 2003
21.369
-2.862
-11.81%
jan 1, 2004
21.695
+0.326
1.53%
jan 1, 2005
22.343
+0.648
2.99%
jan 1, 2006
25.543
+3.2
14.32%
jan 1, 2007
27.689
+2.145
8.4%
jan 1, 2008
26.644
-1.045
-3.77%
jan 1, 2009
32.468
+5.824
21.86%
jan 1, 2010
28.139
-4.329
-13.33%
jan 1, 2011
28.621
+0.483
1.72%
jan 1, 2012
32.89
+4.269
14.91%
jan 1, 2013
35.581
+2.69
8.18%
jan 1, 2014
34.6
-0.98
-2.76%
jan 1, 2015
33.147
-1.454
-4.2%
jan 1, 2016
23.457
-9.69
-29.23%
Ranking of countries by current statistics by years


Comments: