29
/
en
AIzaSyAYiBZKx7MnpbEhh9jyipgxe19OcubqV5w
April 1, 2024
142980
Grenada
GRD
true
2
1
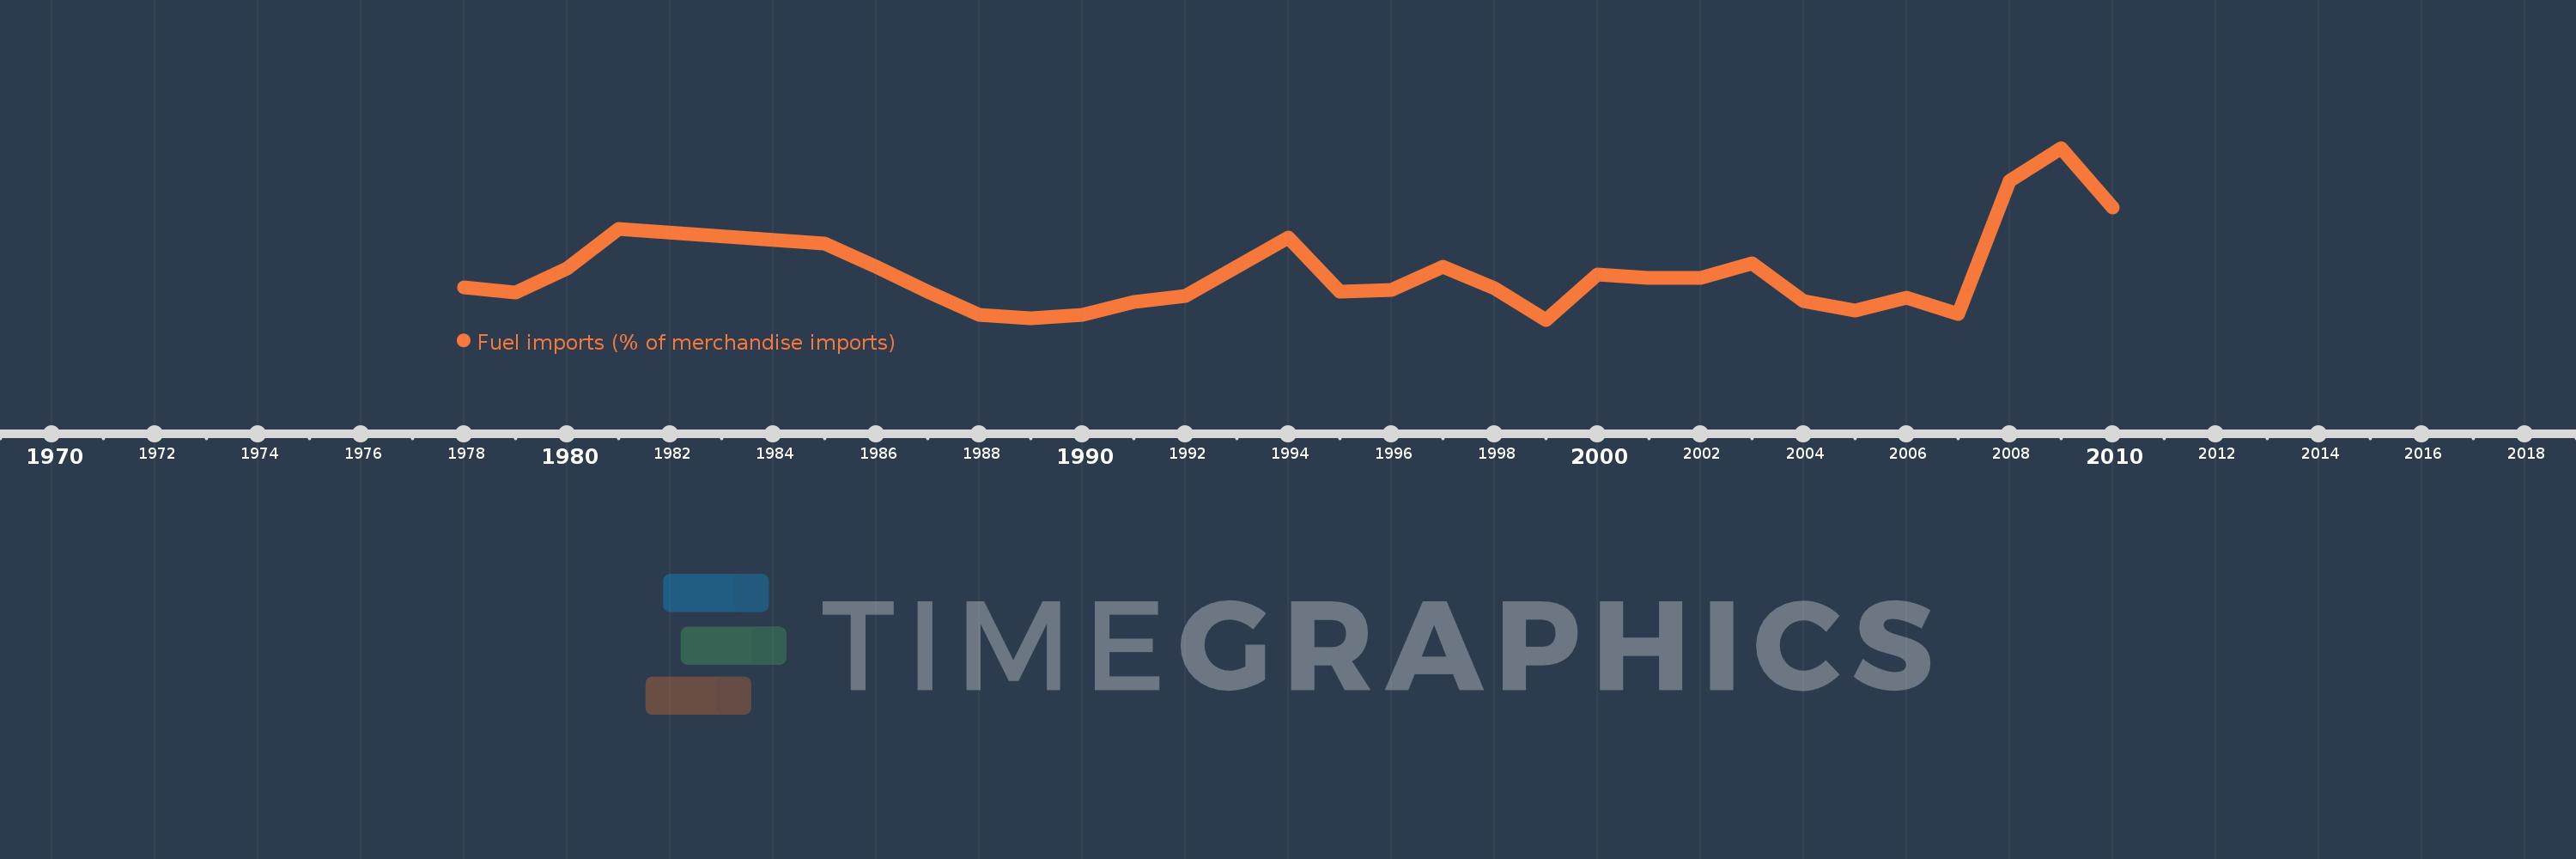
Fuel imports (% of merchandise imports)
2010,2009,2008,2007,2006,2005,2004,2003,2002,2001,2000,1999,1998,1997,1996,1995,1994,1992,1991,1990,1989,1988,1987,1986,1985,1981,1980,1979,1978
This statistics in other country:
AfghanistanAlbaniaAlgeriaAndorraAngolaAntigua and BarbudaArab WorldArgentinaArmeniaArubaAustraliaAustriaAzerbaijanBahamas, TheBahrainBangladeshBarbadosBelarusBelgiumBelizeBeninBermudaBhutanBoliviaBosnia and HerzegovinaBotswanaBrazilBrunei DarussalamBulgariaBurkina FasoBurundiCabo VerdeCambodiaCameroonCanadaCaribbean small statesCayman IslandsCentral African RepublicCentral Europe and the BalticsChadChileChinaColombiaComorosCongo, Dem. Rep.Congo, Rep.Costa RicaCote d'IvoireCroatiaCubaCyprusCzech RepublicDenmarkDjiboutiDominicaDominican RepublicEarly-demographic dividendEast Asia & PacificEast Asia & Pacific (excluding high income)East Asia & Pacific (IDA & IBRD countries)EcuadorEgypt, Arab Rep.El SalvadorEquatorial GuineaEritreaEstoniaEthiopiaEuro areaEurope & Central AsiaEurope & Central Asia (excluding high income)Europe & Central Asia (IDA & IBRD countries)European UnionFaroe IslandsFijiFinlandFragile and conflict affected situationsFranceFrench PolynesiaGabonGambia, TheGeorgiaGermanyGhanaGreeceGreenlandGrenadaGuatemalaGuineaGuinea-BissauGuyanaHaitiHeavily indebted poor countries (HIPC)High incomeHondurasHong Kong SAR, ChinaHungaryIBRD onlyIcelandIDA & IBRD totalIDA blendIDA onlyIDA totalIndiaIndonesiaIran, Islamic Rep.IraqIrelandIsraelItalyJamaicaJapanJordanKazakhstanKenyaKiribatiKorea, Rep.KuwaitKyrgyz RepublicLao PDRLate-demographic dividendLatin America & Caribbean Latin America & Caribbean (excluding high income)Latin America & the Caribbean (IDA & IBRD countries)LatviaLeast developed countries: UN classificationLebanonLesothoLiberiaLibyaLithuaniaLow & middle incomeLow incomeLower middle incomeLuxembourgMacao SAR, ChinaMacedonia, FYRMadagascarMalawiMalaysiaMaldivesMaliMaltaMauritaniaMauritiusMexicoMiddle East & North AfricaMiddle East & North Africa (excluding high income)Middle East & North Africa (IDA & IBRD countries)Middle incomeMoldovaMongoliaMoroccoMozambiqueMyanmarNamibiaNepalNetherlandsNew CaledoniaNew ZealandNicaraguaNigerNigeriaNorth AmericaNorwayOECD membersOmanOther small statesPacific island small statesPakistanPalauPanamaPapua New GuineaParaguayPeruPhilippinesPolandPortugalPost-demographic dividendPre-demographic dividendQatarRomaniaRussian FederationRwandaSamoaSao Tome and PrincipeSaudi ArabiaSenegalSerbiaSeychellesSierra LeoneSingaporeSlovak RepublicSloveniaSmall statesSolomon IslandsSomaliaSouth AfricaSouth AsiaSouth Asia (IDA & IBRD)SpainSri LankaSt. Kitts and NevisSt. LuciaSt. Vincent and the GrenadinesSub-Saharan Africa Sub-Saharan Africa (excluding high income)Sub-Saharan Africa (IDA & IBRD countries)SudanSurinameSwazilandSwedenSwitzerlandSyrian Arab RepublicTajikistanTanzaniaThailandTimor-LesteTogoTongaTrinidad and TobagoTunisiaTurkeyTurkmenistanTurks and Caicos IslandsTuvaluUgandaUkraineUnited Arab EmiratesUnited KingdomUnited StatesUpper middle incomeUruguayVanuatuVenezuela, RBVietnamVirgin Islands (U.S.)WorldYemen, Rep.ZambiaZimbabwe Timeline:
This timeline shows a graph from 1978 to 2010 of Grenada. No data until 1977. Number of actual observations by date: 29.
Source name:
World Development Indicators
Source organization:
World Bank staff estimates from the Comtrade database maintained by the United Nations Statistics Division.
Categories, topics:
Energy & Mining, Private Sector, Trade
Last updated:
apr 23, 2017
Indicators value changes by year
Maximum:
19.331
jan 1, 2009
At the date of observation
Value
Absolute change
Change from previous value
jan 1, 1978
8.015
+8.015
0.0%
jan 1, 1979
7.594
-0.421
-5.25%
jan 1, 1980
9.598
+2.005
26.4%
jan 1, 1981
12.779
+3.181
33.14%
jan 1, 1985
11.56
-1.219
-9.54%
jan 1, 1986
9.685
-1.875
-16.22%
jan 1, 1987
7.724
-1.961
-20.25%
jan 1, 1988
5.846
-1.878
-24.31%
jan 1, 1989
5.505
-0.341
-5.83%
jan 1, 1990
5.829
+0.323
5.87%
jan 1, 1991
6.843
+1.014
17.4%
jan 1, 1992
7.373
+0.53
7.75%
jan 1, 1994
12.05
+4.677
63.44%
jan 1, 1995
7.682
-4.368
-36.25%
jan 1, 1996
7.815
+0.132
1.72%
jan 1, 1997
9.737
+1.923
24.6%
jan 1, 1998
8.001
-1.736
-17.83%
jan 1, 1999
5.418
-2.583
-32.29%
jan 1, 2000
9.075
+3.657
67.5%
jan 1, 2001
8.775
-0.3
-3.3%
jan 1, 2002
8.819
+0.043
0.49%
jan 1, 2003
10.013
+1.195
13.55%
jan 1, 2004
6.923
-3.09
-30.86%
jan 1, 2005
6.154
-0.769
-11.11%
jan 1, 2006
7.172
+1.018
16.54%
jan 1, 2007
5.905
-1.266
-17.66%
jan 1, 2008
16.676
+10.77
182.38%
jan 1, 2009
19.331
+2.655
15.92%
jan 1, 2010
14.519
-4.812
-24.89%
Ranking of countries by current statistics by years


Comments: