29
/
en
AIzaSyAYiBZKx7MnpbEhh9jyipgxe19OcubqV5w
April 1, 2024
182921
Macao SAR, China
MAC
true
2
1
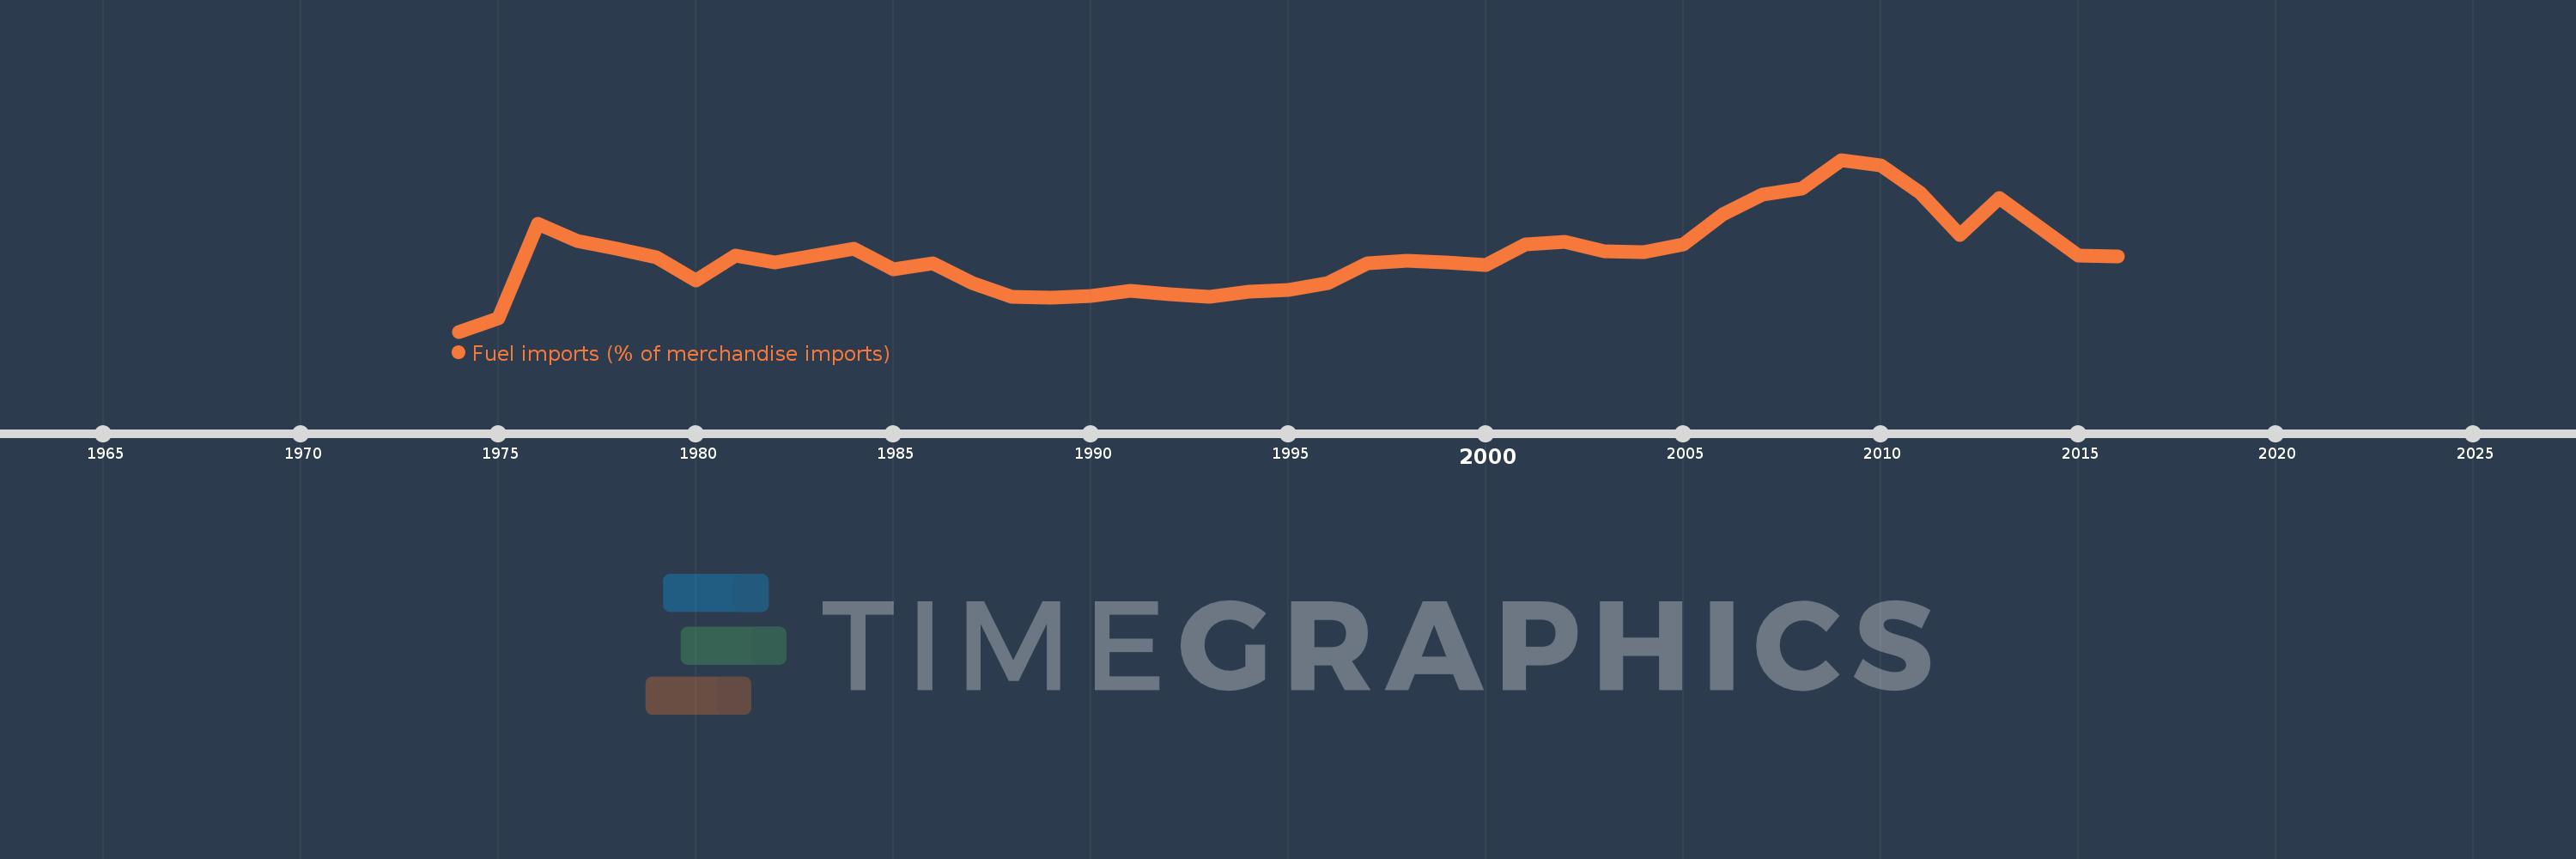
Fuel imports (% of merchandise imports)
2016,2015,2013,2012,2011,2010,2009,2008,2007,2006,2005,2004,2003,2002,2001,2000,1999,1998,1997,1996,1995,1994,1993,1992,1991,1990,1989,1988,1987,1986,1985,1984,1982,1981,1980,1979,1978,1977,1976,1975,1974
This statistics in other country:
AfghanistanAlbaniaAlgeriaAndorraAngolaAntigua and BarbudaArab WorldArgentinaArmeniaArubaAustraliaAustriaAzerbaijanBahamas, TheBahrainBangladeshBarbadosBelarusBelgiumBelizeBeninBermudaBhutanBoliviaBosnia and HerzegovinaBotswanaBrazilBrunei DarussalamBulgariaBurkina FasoBurundiCabo VerdeCambodiaCameroonCanadaCaribbean small statesCayman IslandsCentral African RepublicCentral Europe and the BalticsChadChileChinaColombiaComorosCongo, Dem. Rep.Congo, Rep.Costa RicaCote d'IvoireCroatiaCubaCyprusCzech RepublicDenmarkDjiboutiDominicaDominican RepublicEarly-demographic dividendEast Asia & PacificEast Asia & Pacific (excluding high income)East Asia & Pacific (IDA & IBRD countries)EcuadorEgypt, Arab Rep.El SalvadorEquatorial GuineaEritreaEstoniaEthiopiaEuro areaEurope & Central AsiaEurope & Central Asia (excluding high income)Europe & Central Asia (IDA & IBRD countries)European UnionFaroe IslandsFijiFinlandFragile and conflict affected situationsFranceFrench PolynesiaGabonGambia, TheGeorgiaGermanyGhanaGreeceGreenlandGrenadaGuatemalaGuineaGuinea-BissauGuyanaHaitiHeavily indebted poor countries (HIPC)High incomeHondurasHong Kong SAR, ChinaHungaryIBRD onlyIcelandIDA & IBRD totalIDA blendIDA onlyIDA totalIndiaIndonesiaIran, Islamic Rep.IraqIrelandIsraelItalyJamaicaJapanJordanKazakhstanKenyaKiribatiKorea, Rep.KuwaitKyrgyz RepublicLao PDRLate-demographic dividendLatin America & Caribbean Latin America & Caribbean (excluding high income)Latin America & the Caribbean (IDA & IBRD countries)LatviaLeast developed countries: UN classificationLebanonLesothoLiberiaLibyaLithuaniaLow & middle incomeLow incomeLower middle incomeLuxembourgMacao SAR, ChinaMacedonia, FYRMadagascarMalawiMalaysiaMaldivesMaliMaltaMauritaniaMauritiusMexicoMiddle East & North AfricaMiddle East & North Africa (excluding high income)Middle East & North Africa (IDA & IBRD countries)Middle incomeMoldovaMongoliaMoroccoMozambiqueMyanmarNamibiaNepalNetherlandsNew CaledoniaNew ZealandNicaraguaNigerNigeriaNorth AmericaNorwayOECD membersOmanOther small statesPacific island small statesPakistanPalauPanamaPapua New GuineaParaguayPeruPhilippinesPolandPortugalPost-demographic dividendPre-demographic dividendQatarRomaniaRussian FederationRwandaSamoaSao Tome and PrincipeSaudi ArabiaSenegalSerbiaSeychellesSierra LeoneSingaporeSlovak RepublicSloveniaSmall statesSolomon IslandsSomaliaSouth AfricaSouth AsiaSouth Asia (IDA & IBRD)SpainSri LankaSt. Kitts and NevisSt. LuciaSt. Vincent and the GrenadinesSub-Saharan Africa Sub-Saharan Africa (excluding high income)Sub-Saharan Africa (IDA & IBRD countries)SudanSurinameSwazilandSwedenSwitzerlandSyrian Arab RepublicTajikistanTanzaniaThailandTimor-LesteTogoTongaTrinidad and TobagoTunisiaTurkeyTurkmenistanTurks and Caicos IslandsTuvaluUgandaUkraineUnited Arab EmiratesUnited KingdomUnited StatesUpper middle incomeUruguayVanuatuVenezuela, RBVietnamVirgin Islands (U.S.)WorldYemen, Rep.ZambiaZimbabwe Timeline:
This timeline shows a graph from 1974 to 2016 of Macao SAR, China. No data until 1973. Number of actual observations by date: 41.
Source name:
World Development Indicators
Source organization:
World Bank staff estimates from the Comtrade database maintained by the United Nations Statistics Division.
Categories, topics:
Energy & Mining, Private Sector, Trade
Last updated:
apr 23, 2017
Indicators value changes by year
Maximum:
13.256
jan 1, 2009
At the date of observation
Value
Absolute change
Change from previous value
jan 1, 1974
2.023
+2.023
0.0%
jan 1, 1975
2.899
+0.876
43.33%
jan 1, 1976
9.087
+6.188
213.48%
jan 1, 1977
7.926
-1.161
-12.78%
jan 1, 1978
7.463
-0.463
-5.85%
jan 1, 1979
6.901
-0.562
-7.53%
jan 1, 1980
5.361
-1.54
-22.31%
jan 1, 1981
6.976
+1.615
30.13%
jan 1, 1982
6.536
-0.44
-6.31%
jan 1, 1984
7.422
+0.886
13.55%
jan 1, 1985
6.095
-1.326
-17.87%
jan 1, 1986
6.471
+0.376
6.16%
jan 1, 1987
5.22
-1.251
-19.34%
jan 1, 1988
4.277
-0.943
-18.07%
jan 1, 1989
4.214
-0.062
-1.46%
jan 1, 1990
4.335
+0.121
2.87%
jan 1, 1991
4.699
+0.364
8.39%
jan 1, 1992
4.458
-0.24
-5.12%
jan 1, 1993
4.282
-0.176
-3.96%
jan 1, 1994
4.629
+0.347
8.11%
jan 1, 1995
4.759
+0.13
2.8%
jan 1, 1996
5.186
+0.428
8.98%
jan 1, 1997
6.5
+1.313
25.33%
jan 1, 1998
6.668
+0.168
2.59%
jan 1, 1999
6.539
-0.129
-1.93%
jan 1, 2000
6.401
-0.139
-2.12%
jan 1, 2001
7.704
+1.303
20.36%
jan 1, 2002
7.92
+0.217
2.81%
jan 1, 2003
7.263
-0.657
-8.3%
jan 1, 2004
7.217
-0.046
-0.64%
jan 1, 2005
7.736
+0.519
7.19%
jan 1, 2006
9.715
+1.98
25.59%
jan 1, 2007
10.972
+1.256
12.93%
jan 1, 2008
11.397
+0.426
3.88%
jan 1, 2009
13.256
+1.858
16.3%
jan 1, 2010
12.867
-0.389
-2.93%
jan 1, 2011
11.103
-1.764
-13.71%
jan 1, 2012
8.325
-2.777
-25.02%
jan 1, 2013
10.777
+2.451
29.44%
jan 1, 2015
7.02
-3.757
-34.86%
jan 1, 2016
6.964
-0.056
-0.8%
Ranking of countries by current statistics by years


Comments: