30
/
AIzaSyAYiBZKx7MnpbEhh9jyipgxe19OcubqV5w
April 1, 2024
24099
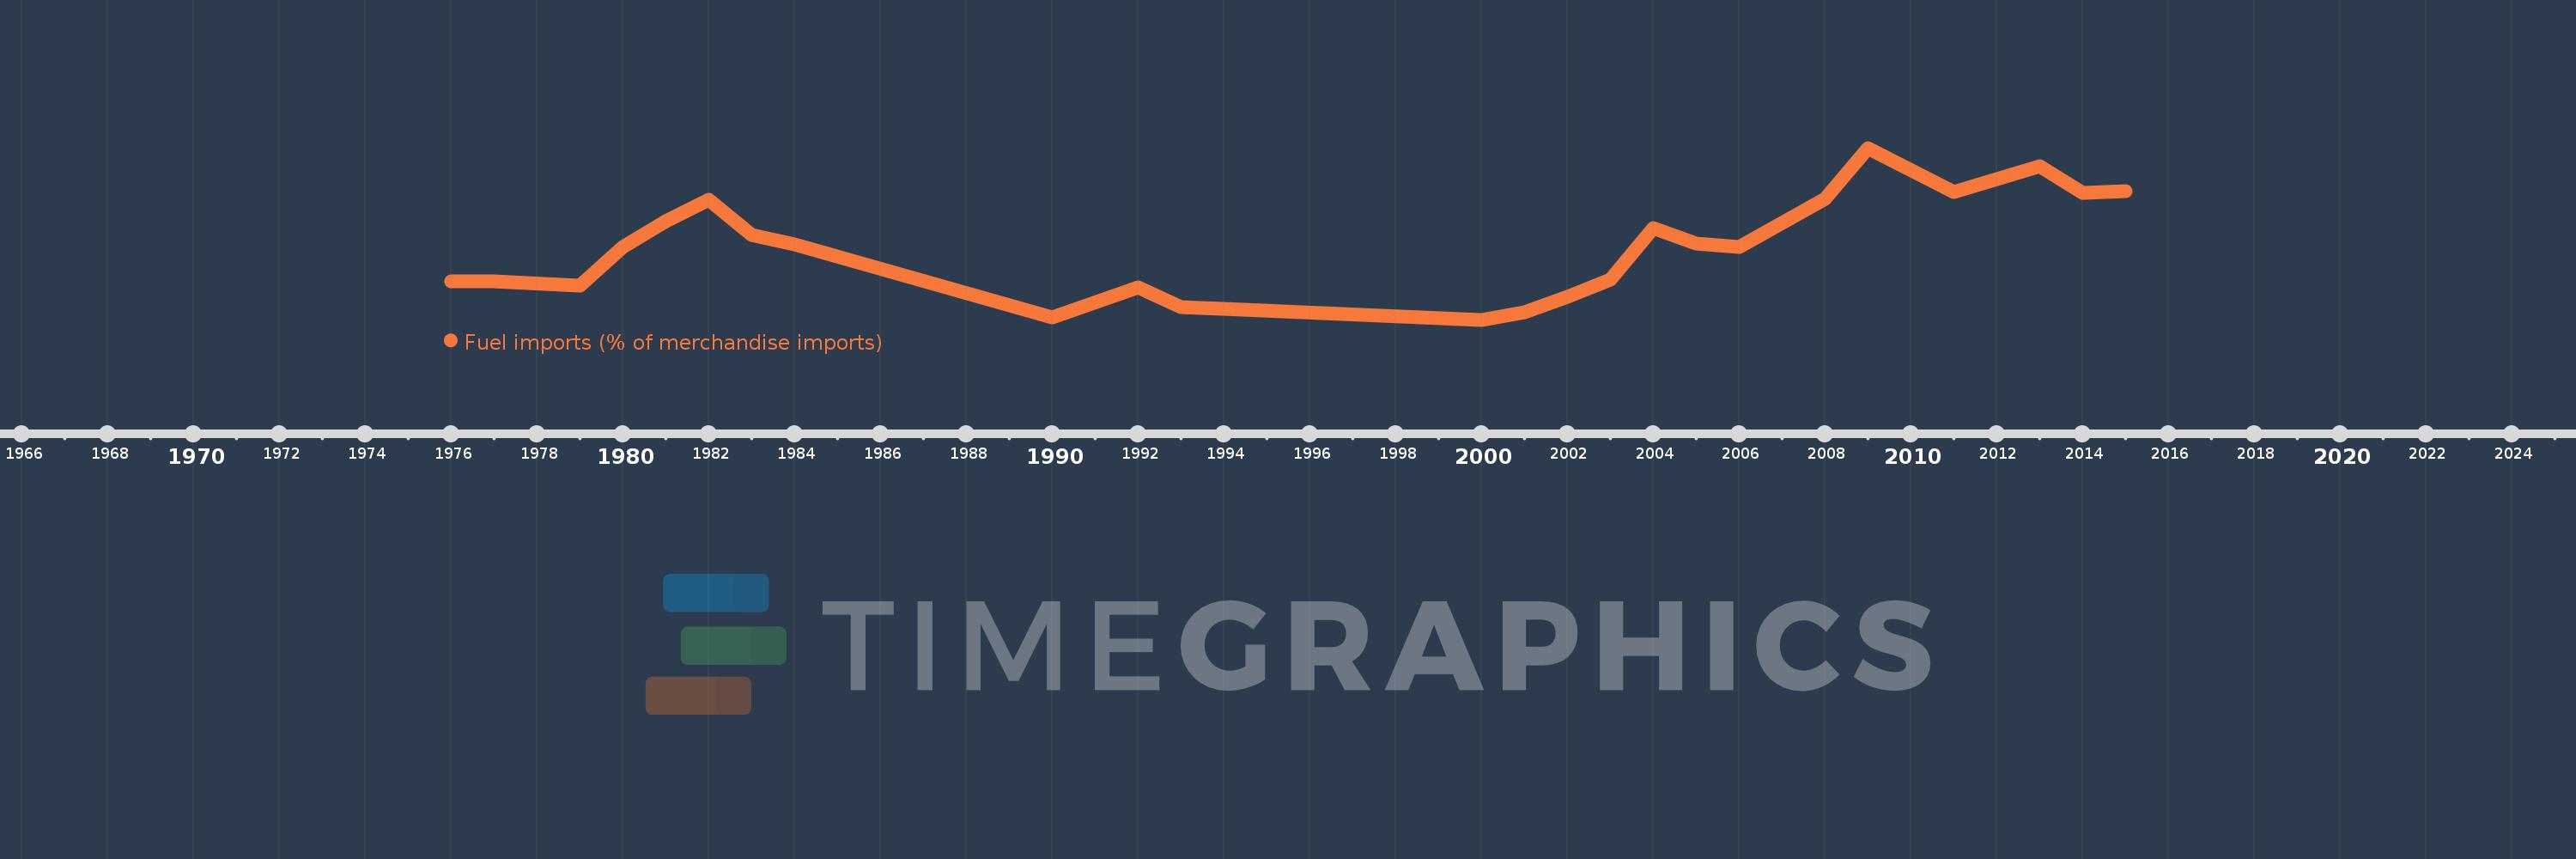
Arab World
ARB
false
2
1
Fuel imports (% of merchandise imports)
2015,2014,2013,2011,2009,2008,2006,2005,2004,2003,2002,2001,2000,1994,1993,1992,1990,1984,1983,1982,1981,1980,1979,1977,1976
