29
/
en
AIzaSyAYiBZKx7MnpbEhh9jyipgxe19OcubqV5w
April 1, 2024
253015
Sudan
SDN
true
2
1
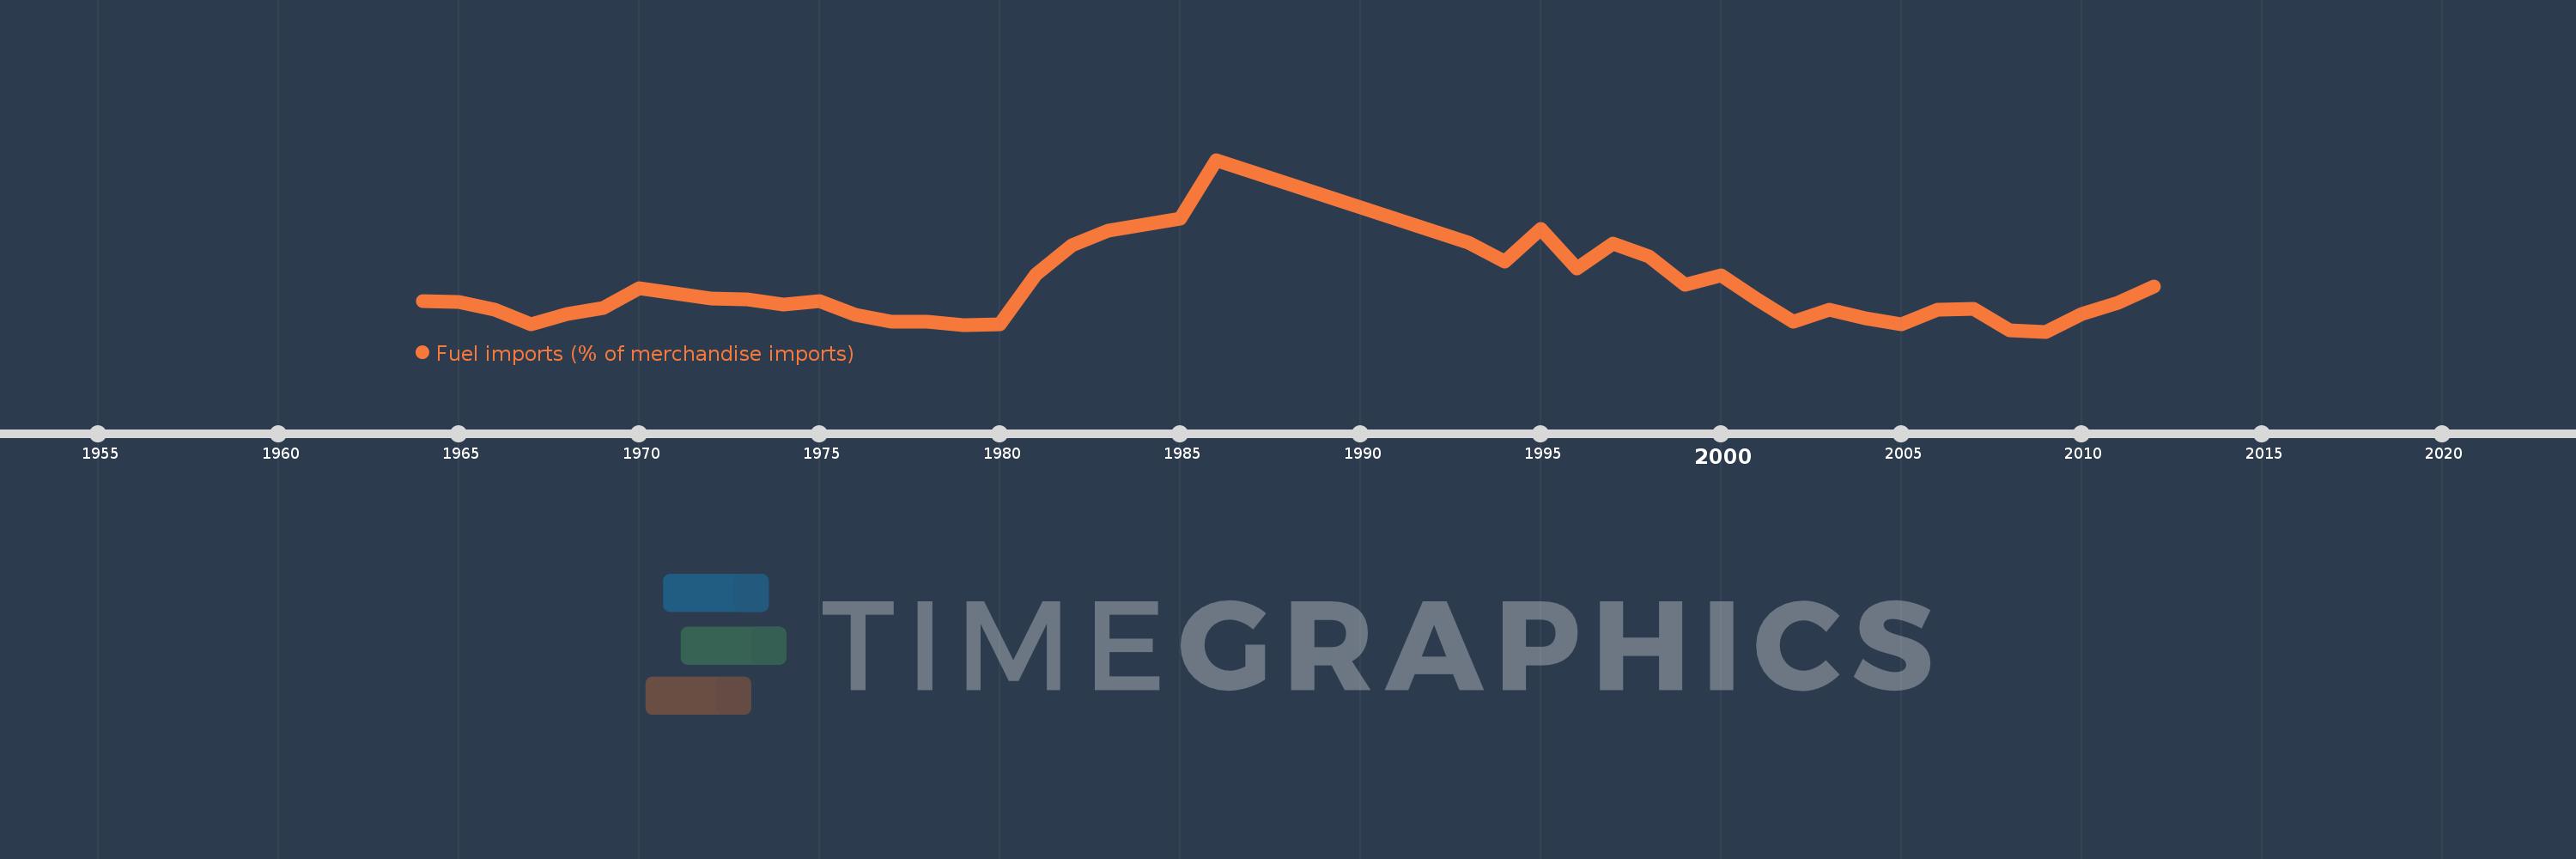
Fuel imports (% of merchandise imports)
2012,2011,2010,2009,2008,2007,2006,2005,2004,2003,2002,2001,2000,1999,1998,1997,1996,1995,1994,1993,1986,1985,1983,1982,1981,1980,1979,1978,1977,1976,1975,1974,1973,1972,1971,1970,1969,1968,1967,1966,1965,1964
This statistics in other country:
AfghanistanAlbaniaAlgeriaAndorraAngolaAntigua and BarbudaArab WorldArgentinaArmeniaArubaAustraliaAustriaAzerbaijanBahamas, TheBahrainBangladeshBarbadosBelarusBelgiumBelizeBeninBermudaBhutanBoliviaBosnia and HerzegovinaBotswanaBrazilBrunei DarussalamBulgariaBurkina FasoBurundiCabo VerdeCambodiaCameroonCanadaCaribbean small statesCayman IslandsCentral African RepublicCentral Europe and the BalticsChadChileChinaColombiaComorosCongo, Dem. Rep.Congo, Rep.Costa RicaCote d'IvoireCroatiaCubaCyprusCzech RepublicDenmarkDjiboutiDominicaDominican RepublicEarly-demographic dividendEast Asia & PacificEast Asia & Pacific (excluding high income)East Asia & Pacific (IDA & IBRD countries)EcuadorEgypt, Arab Rep.El SalvadorEquatorial GuineaEritreaEstoniaEthiopiaEuro areaEurope & Central AsiaEurope & Central Asia (excluding high income)Europe & Central Asia (IDA & IBRD countries)European UnionFaroe IslandsFijiFinlandFragile and conflict affected situationsFranceFrench PolynesiaGabonGambia, TheGeorgiaGermanyGhanaGreeceGreenlandGrenadaGuatemalaGuineaGuinea-BissauGuyanaHaitiHeavily indebted poor countries (HIPC)High incomeHondurasHong Kong SAR, ChinaHungaryIBRD onlyIcelandIDA & IBRD totalIDA blendIDA onlyIDA totalIndiaIndonesiaIran, Islamic Rep.IraqIrelandIsraelItalyJamaicaJapanJordanKazakhstanKenyaKiribatiKorea, Rep.KuwaitKyrgyz RepublicLao PDRLate-demographic dividendLatin America & Caribbean Latin America & Caribbean (excluding high income)Latin America & the Caribbean (IDA & IBRD countries)LatviaLeast developed countries: UN classificationLebanonLesothoLiberiaLibyaLithuaniaLow & middle incomeLow incomeLower middle incomeLuxembourgMacao SAR, ChinaMacedonia, FYRMadagascarMalawiMalaysiaMaldivesMaliMaltaMauritaniaMauritiusMexicoMiddle East & North AfricaMiddle East & North Africa (excluding high income)Middle East & North Africa (IDA & IBRD countries)Middle incomeMoldovaMongoliaMoroccoMozambiqueMyanmarNamibiaNepalNetherlandsNew CaledoniaNew ZealandNicaraguaNigerNigeriaNorth AmericaNorwayOECD membersOmanOther small statesPacific island small statesPakistanPalauPanamaPapua New GuineaParaguayPeruPhilippinesPolandPortugalPost-demographic dividendPre-demographic dividendQatarRomaniaRussian FederationRwandaSamoaSao Tome and PrincipeSaudi ArabiaSenegalSerbiaSeychellesSierra LeoneSingaporeSlovak RepublicSloveniaSmall statesSolomon IslandsSomaliaSouth AfricaSouth AsiaSouth Asia (IDA & IBRD)SpainSri LankaSt. Kitts and NevisSt. LuciaSt. Vincent and the GrenadinesSub-Saharan Africa Sub-Saharan Africa (excluding high income)Sub-Saharan Africa (IDA & IBRD countries)SudanSurinameSwazilandSwedenSwitzerlandSyrian Arab RepublicTajikistanTanzaniaThailandTimor-LesteTogoTongaTrinidad and TobagoTunisiaTurkeyTurkmenistanTurks and Caicos IslandsTuvaluUgandaUkraineUnited Arab EmiratesUnited KingdomUnited StatesUpper middle incomeUruguayVanuatuVenezuela, RBVietnamVirgin Islands (U.S.)WorldYemen, Rep.ZambiaZimbabwe Timeline:
This timeline shows a graph from 1964 to 2012 of Sudan. No data until 1963. Number of actual observations by date: 42.
Source name:
World Development Indicators
Source organization:
World Bank staff estimates from the Comtrade database maintained by the United Nations Statistics Division.
Categories, topics:
Energy & Mining, Private Sector, Trade
Last updated:
apr 23, 2017
Indicators value changes by year
Maximum:
37.757
jan 1, 1986
At the date of observation
Value
Absolute change
Change from previous value
jan 1, 1964
6.803
+6.803
0.0%
jan 1, 1965
6.625
-0.178
-2.61%
jan 1, 1966
4.813
-1.812
-27.35%
jan 1, 1967
1.678
-3.135
-65.14%
jan 1, 1968
4.023
+2.345
139.79%
jan 1, 1969
5.345
+1.322
32.87%
jan 1, 1970
9.582
+4.236
79.25%
jan 1, 1971
8.399
-1.183
-12.35%
jan 1, 1972
7.276
-1.122
-13.36%
jan 1, 1973
7.192
-0.084
-1.16%
jan 1, 1974
5.993
-1.199
-16.67%
jan 1, 1975
6.746
+0.753
12.56%
jan 1, 1976
3.686
-3.059
-45.35%
jan 1, 1977
2.325
-1.361
-36.93%
jan 1, 1978
2.277
-0.048
-2.05%
jan 1, 1979
1.436
-0.841
-36.93%
jan 1, 1980
1.612
+0.176
12.27%
jan 1, 1981
12.632
+11.02
683.4%
jan 1, 1982
19.07
+6.438
50.96%
jan 1, 1983
22.307
+3.237
16.97%
jan 1, 1985
24.899
+2.592
11.62%
jan 1, 1986
37.757
+12.858
51.64%
jan 1, 1993
19.552
-18.205
-48.22%
jan 1, 1994
15.503
-4.049
-20.71%
jan 1, 1995
22.644
+7.142
46.07%
jan 1, 1996
13.874
-8.77
-38.73%
jan 1, 1997
19.35
+5.477
39.47%
jan 1, 1998
16.567
-2.784
-14.39%
jan 1, 1999
10.377
-6.19
-37.36%
jan 1, 2000
12.475
+2.099
20.23%
jan 1, 2001
7.123
-5.352
-42.9%
jan 1, 2002
2.234
-4.889
-68.63%
jan 1, 2003
4.817
+2.583
115.58%
jan 1, 2004
3.069
-1.748
-36.29%
jan 1, 2005
1.623
-1.446
-47.11%
jan 1, 2006
4.938
+3.315
204.18%
jan 1, 2007
5.012
+0.074
1.5%
jan 1, 2008
0.331
-4.681
-93.4%
jan 1, 2009
0.09
-0.241
-72.83%
jan 1, 2010
4.03
+3.94
4.38K%
jan 1, 2011
6.473
+2.443
60.61%
jan 1, 2012
9.91
+3.437
53.11%
Ranking of countries by current statistics by years


Comments: