29
/
en
AIzaSyAYiBZKx7MnpbEhh9jyipgxe19OcubqV5w
April 1, 2024
131453
Faroe Islands
FRO
true
2
1
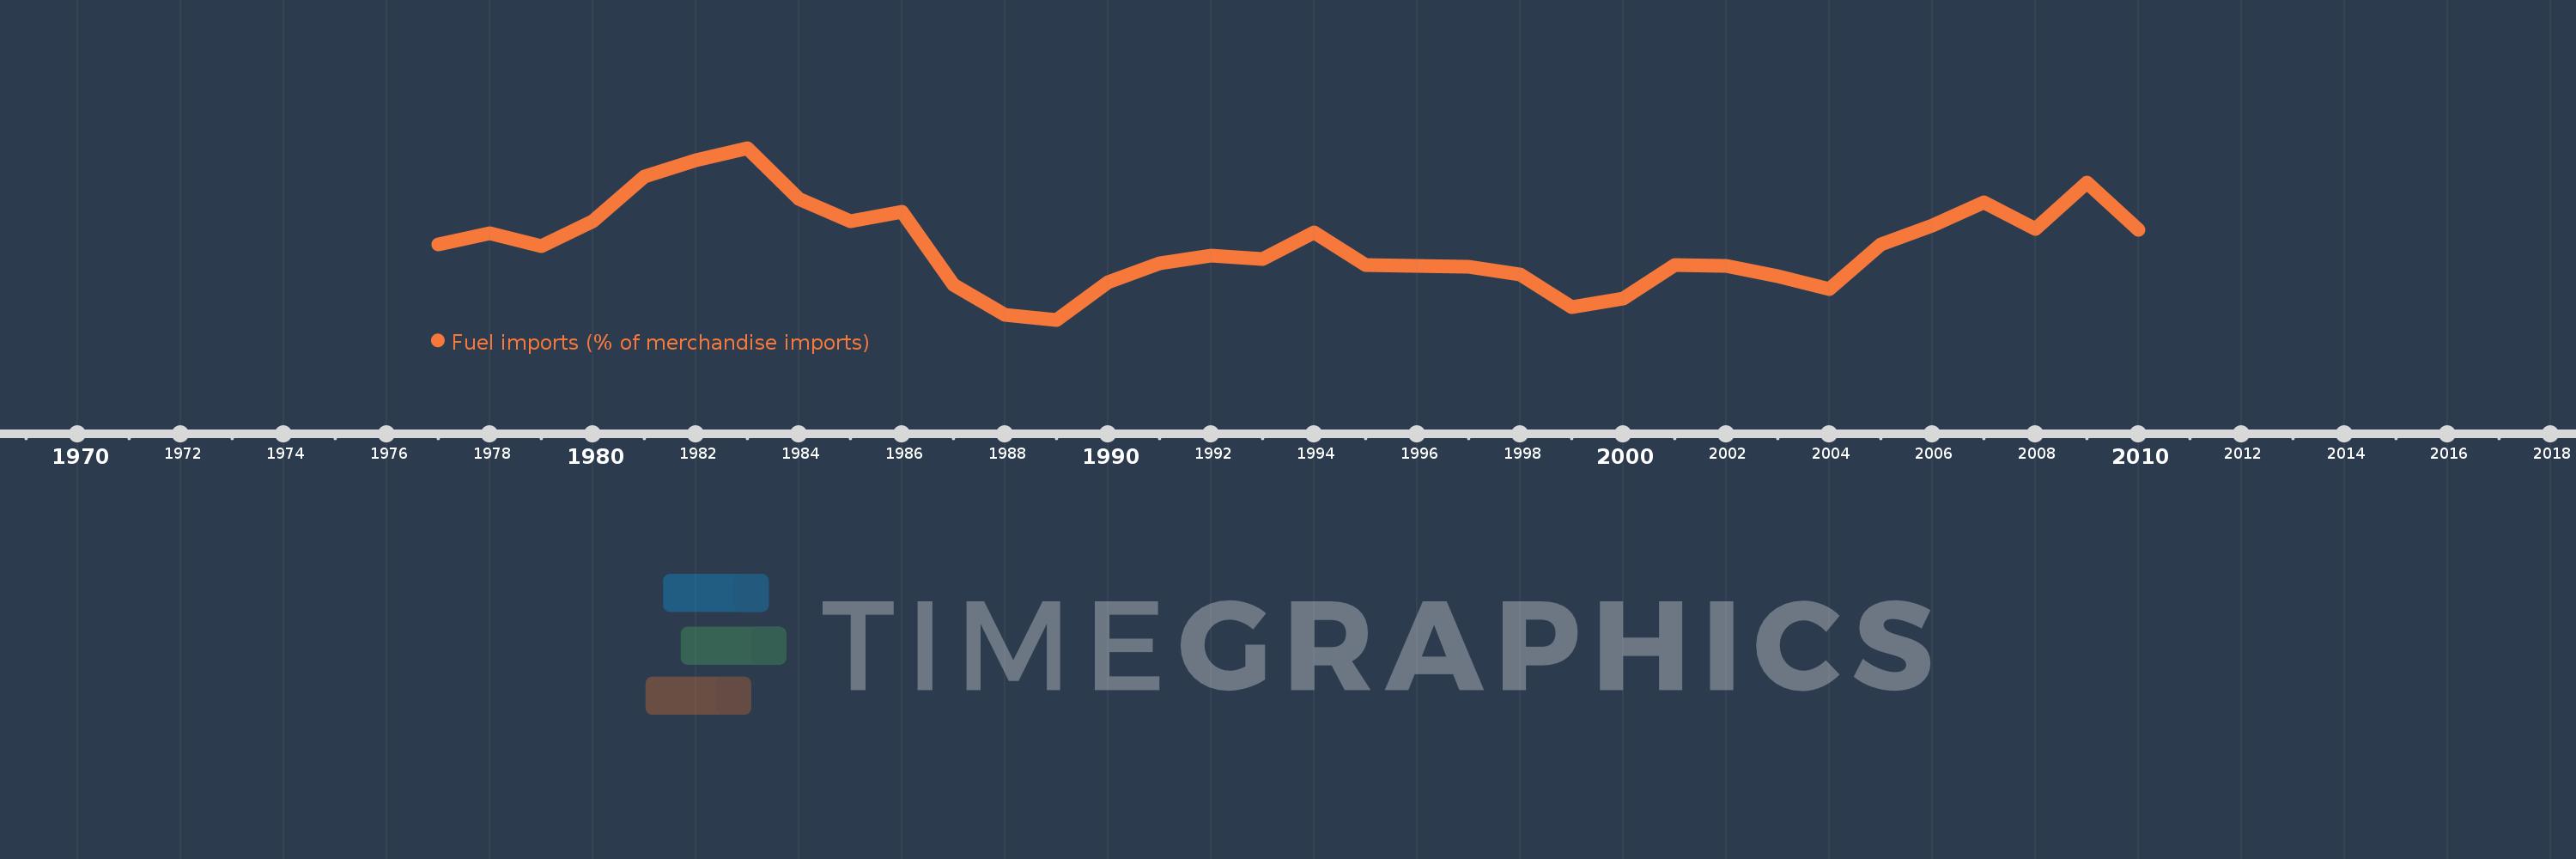
Fuel imports (% of merchandise imports)
2010,2009,2008,2007,2006,2005,2004,2003,2002,2001,2000,1999,1998,1997,1995,1994,1993,1992,1991,1990,1989,1988,1987,1986,1985,1984,1983,1982,1981,1980,1979,1978,1977
This statistics in other country:
AfghanistanAlbaniaAlgeriaAndorraAngolaAntigua and BarbudaArab WorldArgentinaArmeniaArubaAustraliaAustriaAzerbaijanBahamas, TheBahrainBangladeshBarbadosBelarusBelgiumBelizeBeninBermudaBhutanBoliviaBosnia and HerzegovinaBotswanaBrazilBrunei DarussalamBulgariaBurkina FasoBurundiCabo VerdeCambodiaCameroonCanadaCaribbean small statesCayman IslandsCentral African RepublicCentral Europe and the BalticsChadChileChinaColombiaComorosCongo, Dem. Rep.Congo, Rep.Costa RicaCote d'IvoireCroatiaCubaCyprusCzech RepublicDenmarkDjiboutiDominicaDominican RepublicEarly-demographic dividendEast Asia & PacificEast Asia & Pacific (excluding high income)East Asia & Pacific (IDA & IBRD countries)EcuadorEgypt, Arab Rep.El SalvadorEquatorial GuineaEritreaEstoniaEthiopiaEuro areaEurope & Central AsiaEurope & Central Asia (excluding high income)Europe & Central Asia (IDA & IBRD countries)European UnionFaroe IslandsFijiFinlandFragile and conflict affected situationsFranceFrench PolynesiaGabonGambia, TheGeorgiaGermanyGhanaGreeceGreenlandGrenadaGuatemalaGuineaGuinea-BissauGuyanaHaitiHeavily indebted poor countries (HIPC)High incomeHondurasHong Kong SAR, ChinaHungaryIBRD onlyIcelandIDA & IBRD totalIDA blendIDA onlyIDA totalIndiaIndonesiaIran, Islamic Rep.IraqIrelandIsraelItalyJamaicaJapanJordanKazakhstanKenyaKiribatiKorea, Rep.KuwaitKyrgyz RepublicLao PDRLate-demographic dividendLatin America & Caribbean Latin America & Caribbean (excluding high income)Latin America & the Caribbean (IDA & IBRD countries)LatviaLeast developed countries: UN classificationLebanonLesothoLiberiaLibyaLithuaniaLow & middle incomeLow incomeLower middle incomeLuxembourgMacao SAR, ChinaMacedonia, FYRMadagascarMalawiMalaysiaMaldivesMaliMaltaMauritaniaMauritiusMexicoMiddle East & North AfricaMiddle East & North Africa (excluding high income)Middle East & North Africa (IDA & IBRD countries)Middle incomeMoldovaMongoliaMoroccoMozambiqueMyanmarNamibiaNepalNetherlandsNew CaledoniaNew ZealandNicaraguaNigerNigeriaNorth AmericaNorwayOECD membersOmanOther small statesPacific island small statesPakistanPalauPanamaPapua New GuineaParaguayPeruPhilippinesPolandPortugalPost-demographic dividendPre-demographic dividendQatarRomaniaRussian FederationRwandaSamoaSao Tome and PrincipeSaudi ArabiaSenegalSerbiaSeychellesSierra LeoneSingaporeSlovak RepublicSloveniaSmall statesSolomon IslandsSomaliaSouth AfricaSouth AsiaSouth Asia (IDA & IBRD)SpainSri LankaSt. Kitts and NevisSt. LuciaSt. Vincent and the GrenadinesSub-Saharan Africa Sub-Saharan Africa (excluding high income)Sub-Saharan Africa (IDA & IBRD countries)SudanSurinameSwazilandSwedenSwitzerlandSyrian Arab RepublicTajikistanTanzaniaThailandTimor-LesteTogoTongaTrinidad and TobagoTunisiaTurkeyTurkmenistanTurks and Caicos IslandsTuvaluUgandaUkraineUnited Arab EmiratesUnited KingdomUnited StatesUpper middle incomeUruguayVanuatuVenezuela, RBVietnamVirgin Islands (U.S.)WorldYemen, Rep.ZambiaZimbabwe Timeline:
This timeline shows a graph from 1977 to 2010 of Faroe Islands. No data until 1976. Number of actual observations by date: 33.
Source name:
World Development Indicators
Source organization:
World Bank staff estimates from the Comtrade database maintained by the United Nations Statistics Division.
Categories, topics:
Energy & Mining, Private Sector, Trade
Last updated:
apr 23, 2017
Indicators value changes by year
Maximum:
24.791
jan 1, 1983
At the date of observation
Value
Absolute change
Change from previous value
jan 1, 1977
14.114
+14.114
0.0%
jan 1, 1978
15.412
+1.299
9.2%
jan 1, 1979
13.961
-1.451
-9.42%
jan 1, 1980
16.727
+2.765
19.81%
jan 1, 1981
21.676
+4.949
29.59%
jan 1, 1982
23.393
+1.718
7.92%
jan 1, 1983
24.791
+1.398
5.97%
jan 1, 1984
19.167
-5.624
-22.68%
jan 1, 1985
16.706
-2.461
-12.84%
jan 1, 1986
17.726
+1.02
6.11%
jan 1, 1987
9.651
-8.075
-45.55%
jan 1, 1988
6.328
-3.323
-34.43%
jan 1, 1989
5.815
-0.513
-8.11%
jan 1, 1990
10.003
+4.188
72.02%
jan 1, 1991
12.066
+2.063
20.63%
jan 1, 1992
12.86
+0.794
6.58%
jan 1, 1993
12.526
-0.334
-2.6%
jan 1, 1994
15.472
+2.946
23.52%
jan 1, 1995
11.855
-3.617
-23.38%
jan 1, 1997
11.682
-0.173
-1.46%
jan 1, 1998
10.8
-0.881
-7.54%
jan 1, 1999
7.245
-3.556
-32.92%
jan 1, 2000
8.116
+0.872
12.03%
jan 1, 2001
11.815
+3.699
45.57%
jan 1, 2002
11.765
-0.05
-0.43%
jan 1, 2003
10.66
-1.105
-9.39%
jan 1, 2004
9.172
-1.487
-13.95%
jan 1, 2005
14.134
+4.962
54.09%
jan 1, 2006
16.255
+2.121
15.01%
jan 1, 2007
18.794
+2.539
15.62%
jan 1, 2008
15.83
-2.964
-15.77%
jan 1, 2009
20.982
+5.152
32.55%
jan 1, 2010
15.769
-5.213
-24.84%
Ranking of countries by current statistics by years


Comments: