29
/
en
AIzaSyAYiBZKx7MnpbEhh9jyipgxe19OcubqV5w
April 1, 2024
54066
Pacific island small states
PSS
false
2
1
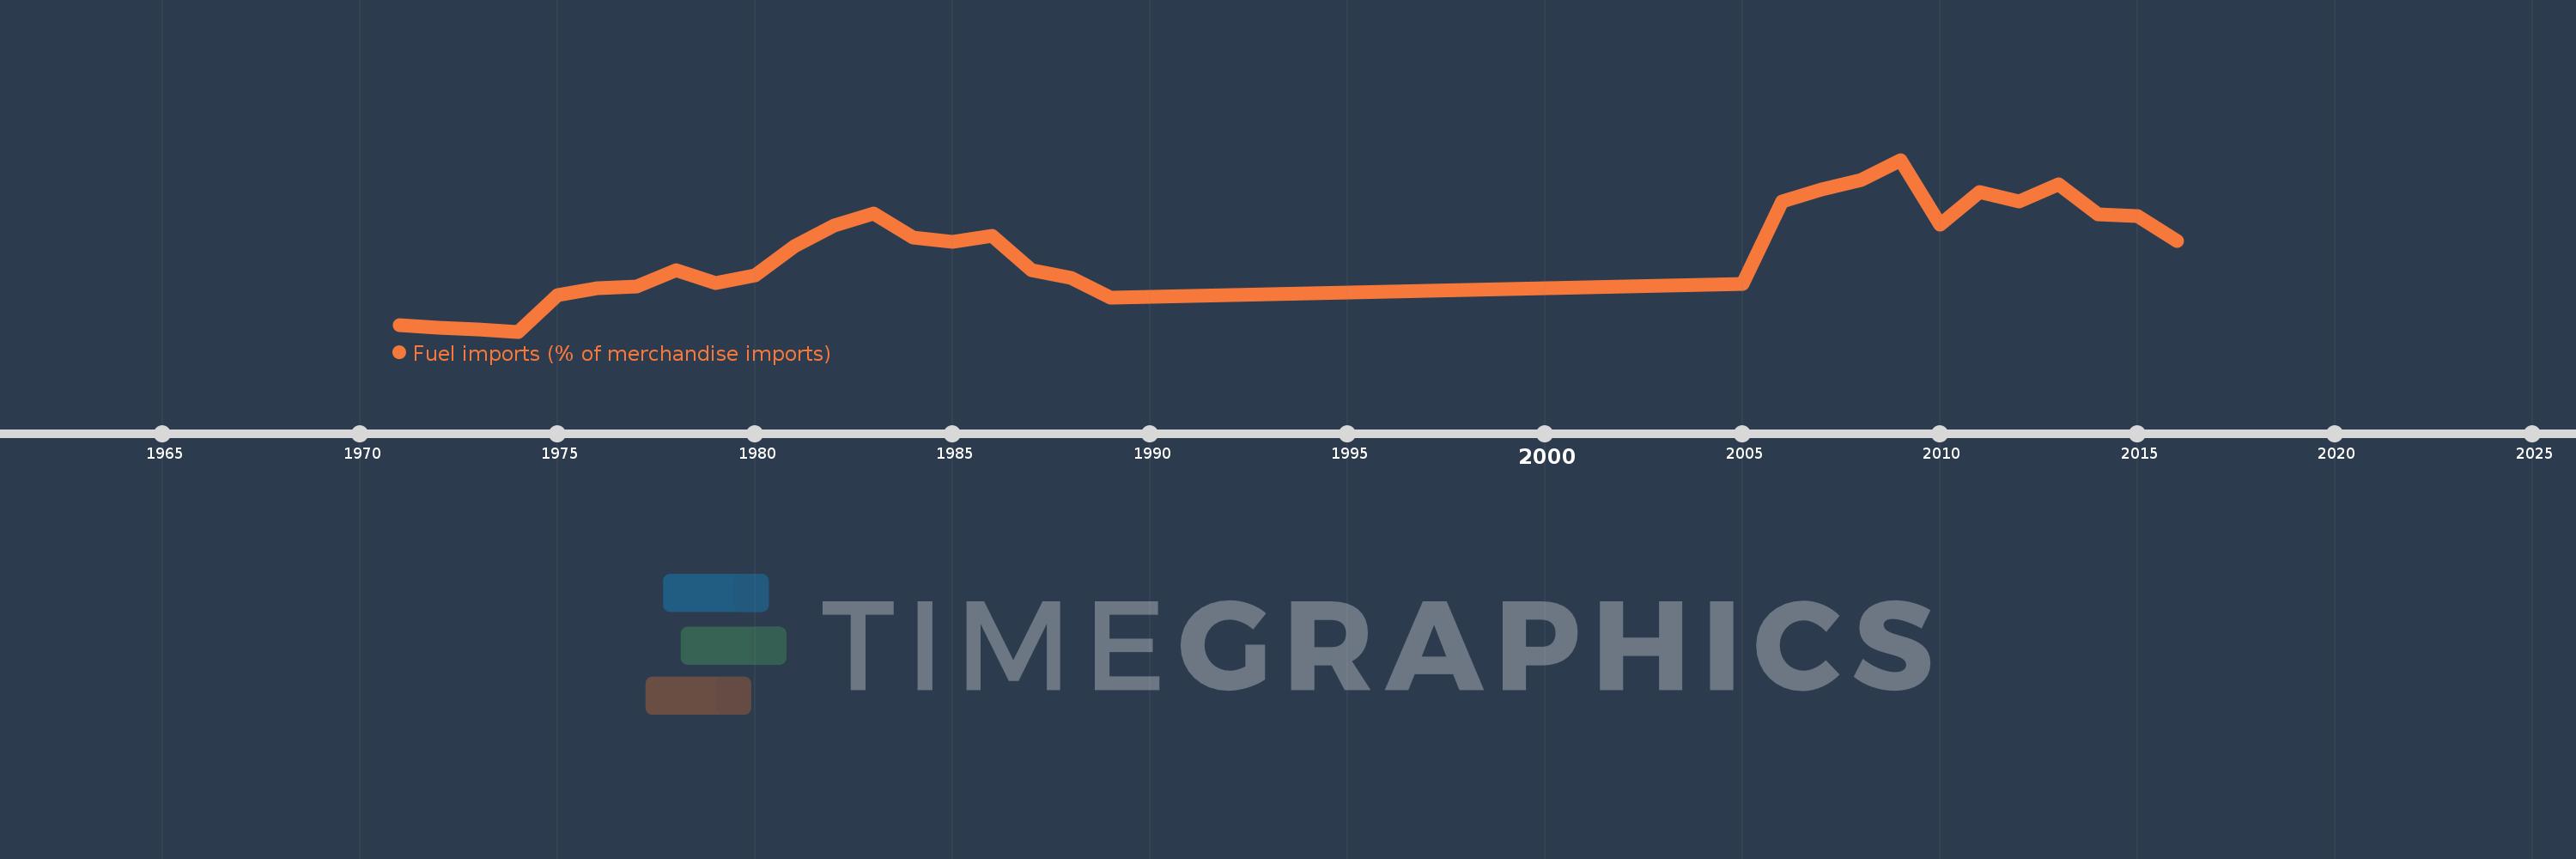
Fuel imports (% of merchandise imports)
2016,2015,2014,2013,2012,2011,2010,2009,2008,2007,2006,2005,1989,1988,1987,1986,1985,1984,1983,1982,1981,1980,1979,1978,1977,1976,1975,1974,1973,1972,1971
This statistics in other country:
AfghanistanAlbaniaAlgeriaAndorraAngolaAntigua and BarbudaArab WorldArgentinaArmeniaArubaAustraliaAustriaAzerbaijanBahamas, TheBahrainBangladeshBarbadosBelarusBelgiumBelizeBeninBermudaBhutanBoliviaBosnia and HerzegovinaBotswanaBrazilBrunei DarussalamBulgariaBurkina FasoBurundiCabo VerdeCambodiaCameroonCanadaCaribbean small statesCayman IslandsCentral African RepublicCentral Europe and the BalticsChadChileChinaColombiaComorosCongo, Dem. Rep.Congo, Rep.Costa RicaCote d'IvoireCroatiaCubaCyprusCzech RepublicDenmarkDjiboutiDominicaDominican RepublicEarly-demographic dividendEast Asia & PacificEast Asia & Pacific (excluding high income)East Asia & Pacific (IDA & IBRD countries)EcuadorEgypt, Arab Rep.El SalvadorEquatorial GuineaEritreaEstoniaEthiopiaEuro areaEurope & Central AsiaEurope & Central Asia (excluding high income)Europe & Central Asia (IDA & IBRD countries)European UnionFaroe IslandsFijiFinlandFragile and conflict affected situationsFranceFrench PolynesiaGabonGambia, TheGeorgiaGermanyGhanaGreeceGreenlandGrenadaGuatemalaGuineaGuinea-BissauGuyanaHaitiHeavily indebted poor countries (HIPC)High incomeHondurasHong Kong SAR, ChinaHungaryIBRD onlyIcelandIDA & IBRD totalIDA blendIDA onlyIDA totalIndiaIndonesiaIran, Islamic Rep.IraqIrelandIsraelItalyJamaicaJapanJordanKazakhstanKenyaKiribatiKorea, Rep.KuwaitKyrgyz RepublicLao PDRLate-demographic dividendLatin America & Caribbean Latin America & Caribbean (excluding high income)Latin America & the Caribbean (IDA & IBRD countries)LatviaLeast developed countries: UN classificationLebanonLesothoLiberiaLibyaLithuaniaLow & middle incomeLow incomeLower middle incomeLuxembourgMacao SAR, ChinaMacedonia, FYRMadagascarMalawiMalaysiaMaldivesMaliMaltaMauritaniaMauritiusMexicoMiddle East & North AfricaMiddle East & North Africa (excluding high income)Middle East & North Africa (IDA & IBRD countries)Middle incomeMoldovaMongoliaMoroccoMozambiqueMyanmarNamibiaNepalNetherlandsNew CaledoniaNew ZealandNicaraguaNigerNigeriaNorth AmericaNorwayOECD membersOmanOther small statesPacific island small statesPakistanPalauPanamaPapua New GuineaParaguayPeruPhilippinesPolandPortugalPost-demographic dividendPre-demographic dividendQatarRomaniaRussian FederationRwandaSamoaSao Tome and PrincipeSaudi ArabiaSenegalSerbiaSeychellesSierra LeoneSingaporeSlovak RepublicSloveniaSmall statesSolomon IslandsSomaliaSouth AfricaSouth AsiaSouth Asia (IDA & IBRD)SpainSri LankaSt. Kitts and NevisSt. LuciaSt. Vincent and the GrenadinesSub-Saharan Africa Sub-Saharan Africa (excluding high income)Sub-Saharan Africa (IDA & IBRD countries)SudanSurinameSwazilandSwedenSwitzerlandSyrian Arab RepublicTajikistanTanzaniaThailandTimor-LesteTogoTongaTrinidad and TobagoTunisiaTurkeyTurkmenistanTurks and Caicos IslandsTuvaluUgandaUkraineUnited Arab EmiratesUnited KingdomUnited StatesUpper middle incomeUruguayVanuatuVenezuela, RBVietnamVirgin Islands (U.S.)WorldYemen, Rep.ZambiaZimbabwe Timeline:
This timeline shows a graph from 1971 to 2016 of Pacific island small states. No data until 1970. Number of actual observations by date: 31.
Source name:
World Development Indicators
Source organization:
World Bank staff estimates from the Comtrade database maintained by the United Nations Statistics Division.
Categories, topics:
Energy & Mining, Private Sector, Trade
Last updated:
apr 23, 2017
Indicators value changes by year
Maximum:
31.975
jan 1, 2009
At the date of observation
Value
Absolute change
Change from previous value
jan 1, 1971
8.95
+8.95
0.0%
jan 1, 1972
8.589
-0.361
-4.03%
jan 1, 1973
8.369
-0.221
-2.57%
jan 1, 1974
8.073
-0.296
-3.53%
jan 1, 1975
13.115
+5.042
62.46%
jan 1, 1976
14.055
+0.939
7.16%
jan 1, 1977
14.289
+0.234
1.67%
jan 1, 1978
16.611
+2.323
16.26%
jan 1, 1979
14.885
-1.727
-10.4%
jan 1, 1980
15.943
+1.058
7.11%
jan 1, 1981
20.011
+4.067
25.51%
jan 1, 1982
22.793
+2.782
13.9%
jan 1, 1983
24.532
+1.739
7.63%
jan 1, 1984
21.172
-3.36
-13.7%
jan 1, 1985
20.591
-0.581
-2.75%
jan 1, 1986
21.432
+0.842
4.09%
jan 1, 1987
16.581
-4.851
-22.63%
jan 1, 1988
15.529
-1.052
-6.35%
jan 1, 1989
12.821
-2.708
-17.44%
jan 1, 2005
14.703
+1.882
14.68%
jan 1, 2006
26.161
+11.458
77.93%
jan 1, 2007
27.83
+1.668
6.38%
jan 1, 2008
29.147
+1.318
4.73%
jan 1, 2009
31.975
+2.828
9.7%
jan 1, 2010
22.912
-9.063
-28.34%
jan 1, 2011
27.453
+4.541
19.82%
jan 1, 2012
26.172
-1.281
-4.67%
jan 1, 2013
28.605
+2.433
9.3%
jan 1, 2014
24.355
-4.25
-14.86%
jan 1, 2015
24.165
-0.19
-0.78%
jan 1, 2016
20.681
-3.484
-14.42%
Ranking of countries by current statistics by years


Comments: