29
/
en
AIzaSyAYiBZKx7MnpbEhh9jyipgxe19OcubqV5w
April 1, 2024
223554
Philippines
PHL
true
2
1
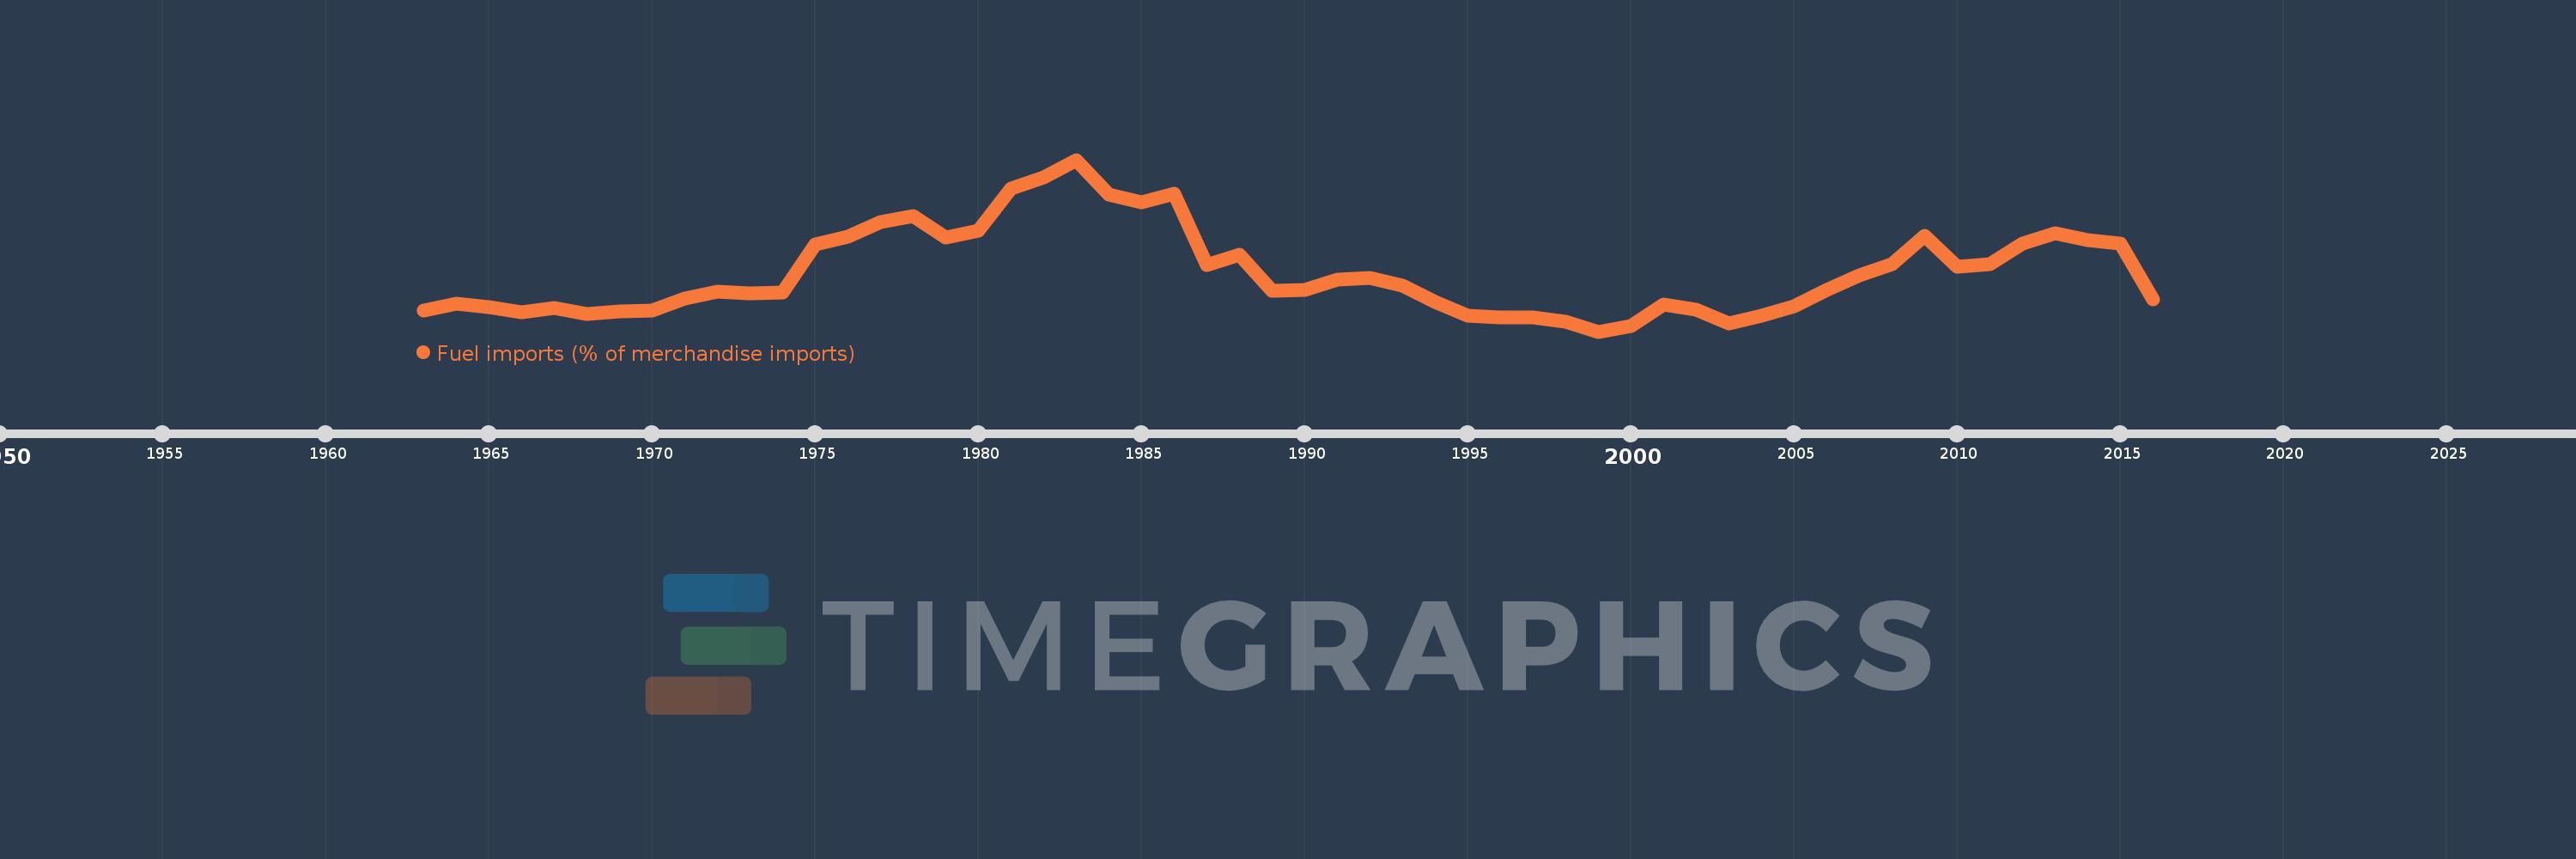
Fuel imports (% of merchandise imports)
2016,2015,2014,2013,2012,2011,2010,2009,2008,2007,2006,2005,2004,2003,2002,2001,2000,1999,1998,1997,1996,1995,1994,1993,1992,1991,1990,1989,1988,1987,1986,1985,1984,1983,1982,1981,1980,1979,1978,1977,1976,1975,1974,1973,1972,1971,1970,1969,1968,1967,1966,1965,1964,1963
This statistics in other country:
AfghanistanAlbaniaAlgeriaAndorraAngolaAntigua and BarbudaArab WorldArgentinaArmeniaArubaAustraliaAustriaAzerbaijanBahamas, TheBahrainBangladeshBarbadosBelarusBelgiumBelizeBeninBermudaBhutanBoliviaBosnia and HerzegovinaBotswanaBrazilBrunei DarussalamBulgariaBurkina FasoBurundiCabo VerdeCambodiaCameroonCanadaCaribbean small statesCayman IslandsCentral African RepublicCentral Europe and the BalticsChadChileChinaColombiaComorosCongo, Dem. Rep.Congo, Rep.Costa RicaCote d'IvoireCroatiaCubaCyprusCzech RepublicDenmarkDjiboutiDominicaDominican RepublicEarly-demographic dividendEast Asia & PacificEast Asia & Pacific (excluding high income)East Asia & Pacific (IDA & IBRD countries)EcuadorEgypt, Arab Rep.El SalvadorEquatorial GuineaEritreaEstoniaEthiopiaEuro areaEurope & Central AsiaEurope & Central Asia (excluding high income)Europe & Central Asia (IDA & IBRD countries)European UnionFaroe IslandsFijiFinlandFragile and conflict affected situationsFranceFrench PolynesiaGabonGambia, TheGeorgiaGermanyGhanaGreeceGreenlandGrenadaGuatemalaGuineaGuinea-BissauGuyanaHaitiHeavily indebted poor countries (HIPC)High incomeHondurasHong Kong SAR, ChinaHungaryIBRD onlyIcelandIDA & IBRD totalIDA blendIDA onlyIDA totalIndiaIndonesiaIran, Islamic Rep.IraqIrelandIsraelItalyJamaicaJapanJordanKazakhstanKenyaKiribatiKorea, Rep.KuwaitKyrgyz RepublicLao PDRLate-demographic dividendLatin America & Caribbean Latin America & Caribbean (excluding high income)Latin America & the Caribbean (IDA & IBRD countries)LatviaLeast developed countries: UN classificationLebanonLesothoLiberiaLibyaLithuaniaLow & middle incomeLow incomeLower middle incomeLuxembourgMacao SAR, ChinaMacedonia, FYRMadagascarMalawiMalaysiaMaldivesMaliMaltaMauritaniaMauritiusMexicoMiddle East & North AfricaMiddle East & North Africa (excluding high income)Middle East & North Africa (IDA & IBRD countries)Middle incomeMoldovaMongoliaMoroccoMozambiqueMyanmarNamibiaNepalNetherlandsNew CaledoniaNew ZealandNicaraguaNigerNigeriaNorth AmericaNorwayOECD membersOmanOther small statesPacific island small statesPakistanPalauPanamaPapua New GuineaParaguayPeruPhilippinesPolandPortugalPost-demographic dividendPre-demographic dividendQatarRomaniaRussian FederationRwandaSamoaSao Tome and PrincipeSaudi ArabiaSenegalSerbiaSeychellesSierra LeoneSingaporeSlovak RepublicSloveniaSmall statesSolomon IslandsSomaliaSouth AfricaSouth AsiaSouth Asia (IDA & IBRD)SpainSri LankaSt. Kitts and NevisSt. LuciaSt. Vincent and the GrenadinesSub-Saharan Africa Sub-Saharan Africa (excluding high income)Sub-Saharan Africa (IDA & IBRD countries)SudanSurinameSwazilandSwedenSwitzerlandSyrian Arab RepublicTajikistanTanzaniaThailandTimor-LesteTogoTongaTrinidad and TobagoTunisiaTurkeyTurkmenistanTurks and Caicos IslandsTuvaluUgandaUkraineUnited Arab EmiratesUnited KingdomUnited StatesUpper middle incomeUruguayVanuatuVenezuela, RBVietnamVirgin Islands (U.S.)WorldYemen, Rep.ZambiaZimbabwe Timeline:
This timeline shows a graph from 1963 to 2016 of Philippines. No data until 1962. Number of actual observations by date: 54.
Source name:
World Development Indicators
Source organization:
World Bank staff estimates from the Comtrade database maintained by the United Nations Statistics Division.
Categories, topics:
Energy & Mining, Private Sector, Trade
Last updated:
apr 23, 2017
Indicators value changes by year
Maximum:
32.694
jan 1, 1983
At the date of observation
Value
Absolute change
Change from previous value
jan 1, 1963
10.196
+10.196
0.0%
jan 1, 1964
11.289
+1.093
10.72%
jan 1, 1965
10.669
-0.62
-5.49%
jan 1, 1966
9.97
-0.698
-6.55%
jan 1, 1967
10.565
+0.595
5.97%
jan 1, 1968
9.665
-0.9
-8.52%
jan 1, 1969
10.131
+0.466
4.82%
jan 1, 1970
10.198
+0.066
0.65%
jan 1, 1971
11.959
+1.761
17.27%
jan 1, 1972
13.095
+1.136
9.5%
jan 1, 1973
12.773
-0.323
-2.46%
jan 1, 1974
12.919
+0.146
1.14%
jan 1, 1975
20.07
+7.151
55.36%
jan 1, 1976
21.189
+1.119
5.57%
jan 1, 1977
23.463
+2.274
10.73%
jan 1, 1978
24.359
+0.896
3.82%
jan 1, 1979
21.153
-3.206
-13.16%
jan 1, 1980
22.177
+1.024
4.84%
jan 1, 1981
28.39
+6.213
28.02%
jan 1, 1982
30.123
+1.733
6.1%
jan 1, 1983
32.694
+2.571
8.54%
jan 1, 1984
27.499
-5.195
-15.89%
jan 1, 1985
26.408
-1.091
-3.97%
jan 1, 1986
27.698
+1.289
4.88%
jan 1, 1987
17.032
-10.665
-38.51%
jan 1, 1988
18.544
+1.512
8.87%
jan 1, 1989
13.205
-5.339
-28.79%
jan 1, 1990
13.321
+0.116
0.88%
jan 1, 1991
14.873
+1.551
11.64%
jan 1, 1992
15.062
+0.189
1.27%
jan 1, 1993
13.886
-1.176
-7.81%
jan 1, 1994
11.456
-2.43
-17.5%
jan 1, 1995
9.463
-1.993
-17.4%
jan 1, 1996
9.177
-0.286
-3.02%
jan 1, 1997
9.201
+0.024
0.26%
jan 1, 1998
8.53
-0.671
-7.29%
jan 1, 1999
7.082
-1.448
-16.97%
jan 1, 2000
7.916
+0.833
11.77%
jan 1, 2001
11.083
+3.167
40.01%
jan 1, 2002
10.285
-0.798
-7.2%
jan 1, 2003
8.338
-1.946
-18.92%
jan 1, 2004
9.403
+1.065
12.77%
jan 1, 2005
10.853
+1.45
15.42%
jan 1, 2006
13.253
+2.4
22.11%
jan 1, 2007
15.419
+2.166
16.35%
jan 1, 2008
17.125
+1.706
11.07%
jan 1, 2009
21.321
+4.196
24.5%
jan 1, 2010
16.786
-4.535
-21.27%
jan 1, 2011
17.108
+0.323
1.92%
jan 1, 2012
20.239
+3.131
18.3%
jan 1, 2013
21.684
+1.445
7.14%
jan 1, 2014
20.688
-0.996
-4.59%
jan 1, 2015
20.201
-0.487
-2.35%
jan 1, 2016
11.88
-8.321
-41.19%
Ranking of countries by current statistics by years


Comments: