29
/
en
AIzaSyAYiBZKx7MnpbEhh9jyipgxe19OcubqV5w
April 1, 2024
136715
Gambia, The
GMB
true
2
1
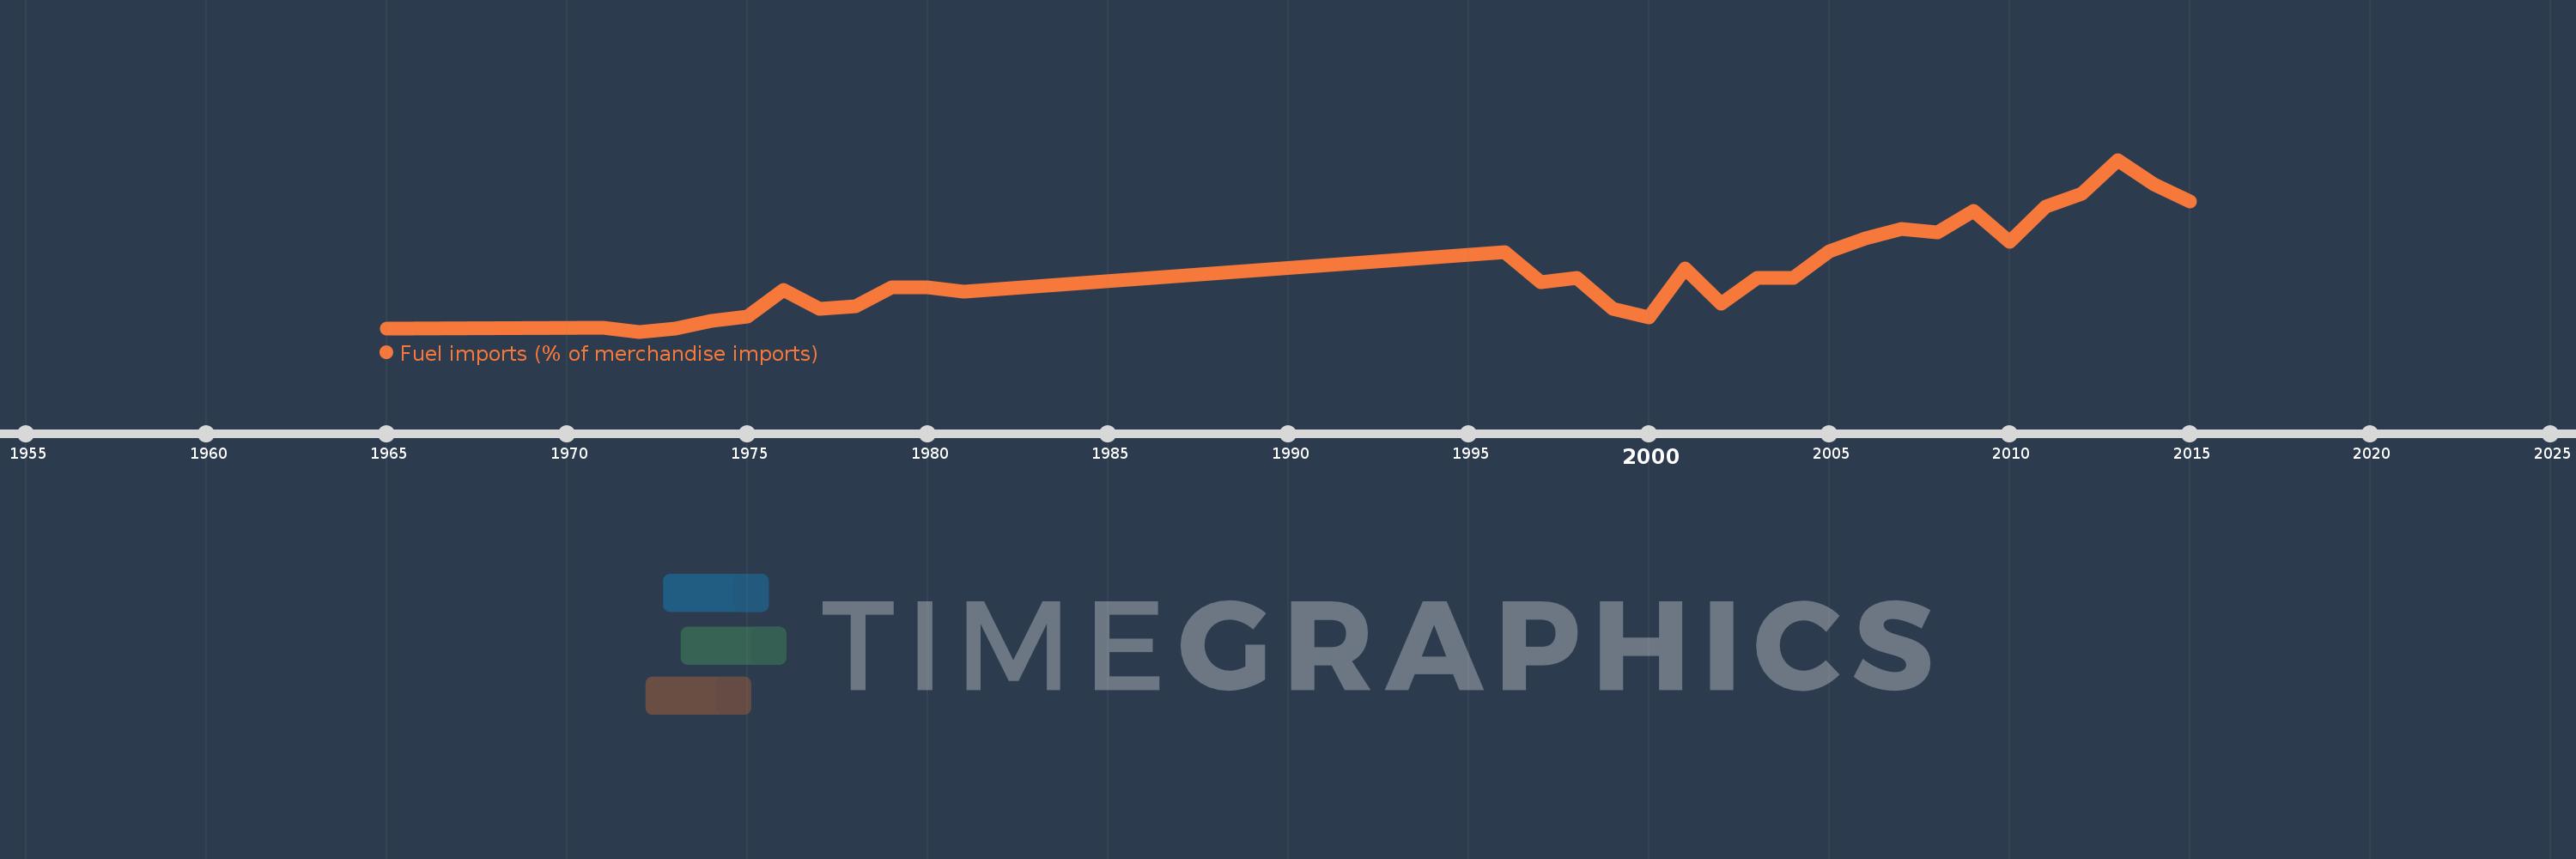
Fuel imports (% of merchandise imports)
2015,2014,2013,2012,2011,2010,2009,2008,2007,2006,2005,2004,2003,2002,2001,2000,1999,1998,1997,1996,1981,1980,1979,1978,1977,1976,1975,1974,1973,1972,1971,1965
This statistics in other country:
AfghanistanAlbaniaAlgeriaAndorraAngolaAntigua and BarbudaArab WorldArgentinaArmeniaArubaAustraliaAustriaAzerbaijanBahamas, TheBahrainBangladeshBarbadosBelarusBelgiumBelizeBeninBermudaBhutanBoliviaBosnia and HerzegovinaBotswanaBrazilBrunei DarussalamBulgariaBurkina FasoBurundiCabo VerdeCambodiaCameroonCanadaCaribbean small statesCayman IslandsCentral African RepublicCentral Europe and the BalticsChadChileChinaColombiaComorosCongo, Dem. Rep.Congo, Rep.Costa RicaCote d'IvoireCroatiaCubaCyprusCzech RepublicDenmarkDjiboutiDominicaDominican RepublicEarly-demographic dividendEast Asia & PacificEast Asia & Pacific (excluding high income)East Asia & Pacific (IDA & IBRD countries)EcuadorEgypt, Arab Rep.El SalvadorEquatorial GuineaEritreaEstoniaEthiopiaEuro areaEurope & Central AsiaEurope & Central Asia (excluding high income)Europe & Central Asia (IDA & IBRD countries)European UnionFaroe IslandsFijiFinlandFragile and conflict affected situationsFranceFrench PolynesiaGabonGambia, TheGeorgiaGermanyGhanaGreeceGreenlandGrenadaGuatemalaGuineaGuinea-BissauGuyanaHaitiHeavily indebted poor countries (HIPC)High incomeHondurasHong Kong SAR, ChinaHungaryIBRD onlyIcelandIDA & IBRD totalIDA blendIDA onlyIDA totalIndiaIndonesiaIran, Islamic Rep.IraqIrelandIsraelItalyJamaicaJapanJordanKazakhstanKenyaKiribatiKorea, Rep.KuwaitKyrgyz RepublicLao PDRLate-demographic dividendLatin America & Caribbean Latin America & Caribbean (excluding high income)Latin America & the Caribbean (IDA & IBRD countries)LatviaLeast developed countries: UN classificationLebanonLesothoLiberiaLibyaLithuaniaLow & middle incomeLow incomeLower middle incomeLuxembourgMacao SAR, ChinaMacedonia, FYRMadagascarMalawiMalaysiaMaldivesMaliMaltaMauritaniaMauritiusMexicoMiddle East & North AfricaMiddle East & North Africa (excluding high income)Middle East & North Africa (IDA & IBRD countries)Middle incomeMoldovaMongoliaMoroccoMozambiqueMyanmarNamibiaNepalNetherlandsNew CaledoniaNew ZealandNicaraguaNigerNigeriaNorth AmericaNorwayOECD membersOmanOther small statesPacific island small statesPakistanPalauPanamaPapua New GuineaParaguayPeruPhilippinesPolandPortugalPost-demographic dividendPre-demographic dividendQatarRomaniaRussian FederationRwandaSamoaSao Tome and PrincipeSaudi ArabiaSenegalSerbiaSeychellesSierra LeoneSingaporeSlovak RepublicSloveniaSmall statesSolomon IslandsSomaliaSouth AfricaSouth AsiaSouth Asia (IDA & IBRD)SpainSri LankaSt. Kitts and NevisSt. LuciaSt. Vincent and the GrenadinesSub-Saharan Africa Sub-Saharan Africa (excluding high income)Sub-Saharan Africa (IDA & IBRD countries)SudanSurinameSwazilandSwedenSwitzerlandSyrian Arab RepublicTajikistanTanzaniaThailandTimor-LesteTogoTongaTrinidad and TobagoTunisiaTurkeyTurkmenistanTurks and Caicos IslandsTuvaluUgandaUkraineUnited Arab EmiratesUnited KingdomUnited StatesUpper middle incomeUruguayVanuatuVenezuela, RBVietnamVirgin Islands (U.S.)WorldYemen, Rep.ZambiaZimbabwe Timeline:
This timeline shows a graph from 1965 to 2015 of Gambia, The. No data until 1964. Number of actual observations by date: 32.
Source name:
World Development Indicators
Source organization:
World Bank staff estimates from the Comtrade database maintained by the United Nations Statistics Division.
Categories, topics:
Energy & Mining, Private Sector, Trade
Last updated:
apr 23, 2017
Indicators value changes by year
Maximum:
27.023
jan 1, 2013
At the date of observation
Value
Absolute change
Change from previous value
jan 1, 1965
3.576
+3.576
0.0%
jan 1, 1971
3.619
+0.042
1.19%
jan 1, 1972
3.135
-0.484
-13.37%
jan 1, 1973
3.508
+0.373
11.9%
jan 1, 1974
4.573
+1.066
30.38%
jan 1, 1975
5.263
+0.689
15.07%
jan 1, 1976
8.928
+3.665
69.64%
jan 1, 1977
6.336
-2.592
-29.03%
jan 1, 1978
6.668
+0.333
5.25%
jan 1, 1979
9.25
+2.582
38.72%
jan 1, 1980
9.312
+0.061
0.66%
jan 1, 1981
8.73
-0.582
-6.25%
jan 1, 1996
14.146
+5.416
62.04%
jan 1, 1997
9.952
-4.194
-29.65%
jan 1, 1998
10.659
+0.707
7.1%
jan 1, 1999
6.307
-4.352
-40.83%
jan 1, 2000
5.112
-1.195
-18.94%
jan 1, 2001
11.944
+6.832
133.65%
jan 1, 2002
7.068
-4.876
-40.82%
jan 1, 2003
10.59
+3.522
49.83%
jan 1, 2004
10.585
-0.005
-0.05%
jan 1, 2005
14.301
+3.716
35.11%
jan 1, 2006
16.051
+1.749
12.23%
jan 1, 2007
17.382
+1.332
8.3%
jan 1, 2008
16.895
-0.488
-2.81%
jan 1, 2009
19.917
+3.023
17.89%
jan 1, 2010
15.615
-4.303
-21.6%
jan 1, 2011
20.532
+4.917
31.49%
jan 1, 2012
22.246
+1.714
8.35%
jan 1, 2013
27.023
+4.777
21.47%
jan 1, 2014
23.59
-3.433
-12.7%
jan 1, 2015
21.27
-2.32
-9.83%
Ranking of countries by current statistics by years


Comments: