29
/
en
AIzaSyAYiBZKx7MnpbEhh9jyipgxe19OcubqV5w
April 1, 2024
262234
Thailand
THA
true
2
1
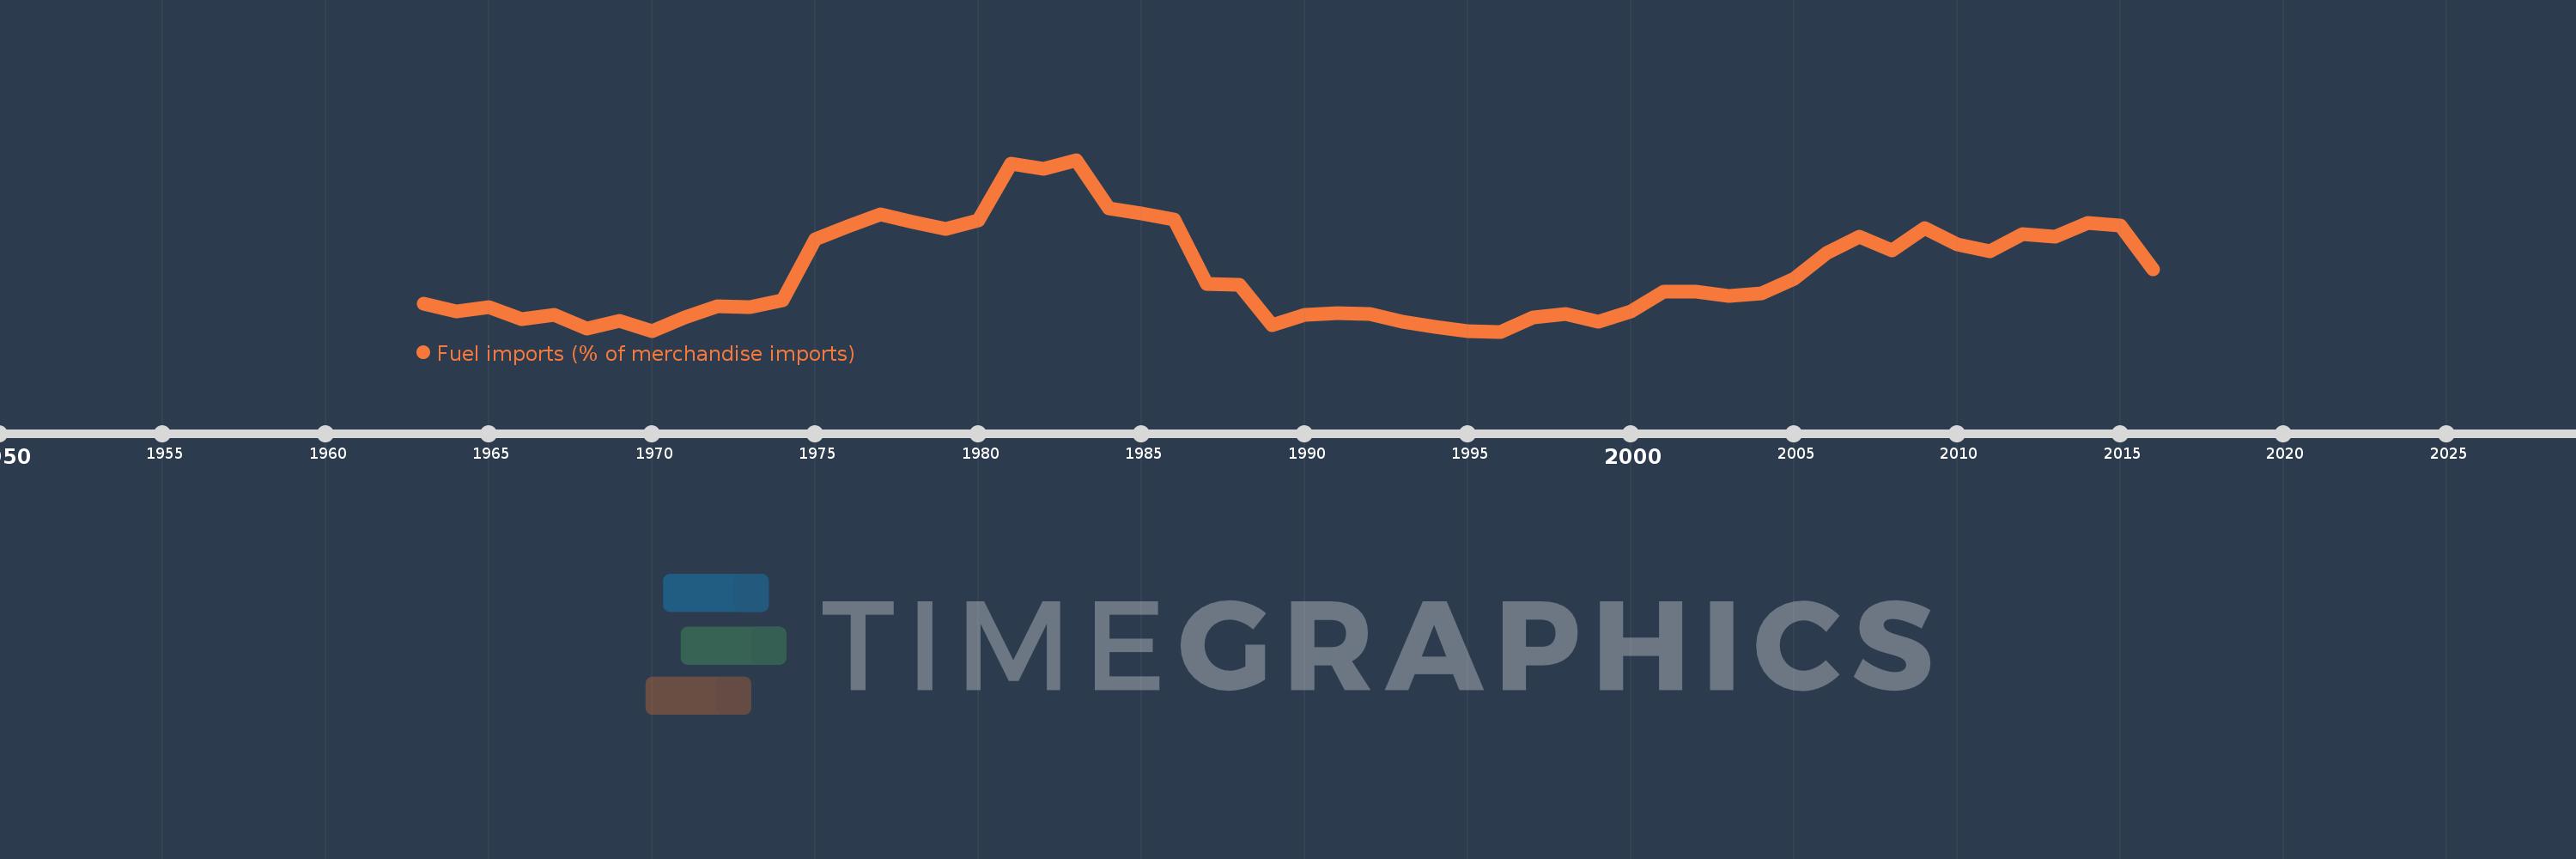
Fuel imports (% of merchandise imports)
2016,2015,2014,2013,2012,2011,2010,2009,2008,2007,2006,2005,2004,2003,2002,2001,2000,1999,1998,1997,1996,1995,1994,1993,1992,1991,1990,1989,1988,1987,1986,1985,1984,1983,1982,1981,1980,1979,1978,1977,1976,1975,1974,1973,1972,1971,1970,1969,1968,1967,1966,1965,1964,1963
This statistics in other country:
AfghanistanAlbaniaAlgeriaAndorraAngolaAntigua and BarbudaArab WorldArgentinaArmeniaArubaAustraliaAustriaAzerbaijanBahamas, TheBahrainBangladeshBarbadosBelarusBelgiumBelizeBeninBermudaBhutanBoliviaBosnia and HerzegovinaBotswanaBrazilBrunei DarussalamBulgariaBurkina FasoBurundiCabo VerdeCambodiaCameroonCanadaCaribbean small statesCayman IslandsCentral African RepublicCentral Europe and the BalticsChadChileChinaColombiaComorosCongo, Dem. Rep.Congo, Rep.Costa RicaCote d'IvoireCroatiaCubaCyprusCzech RepublicDenmarkDjiboutiDominicaDominican RepublicEarly-demographic dividendEast Asia & PacificEast Asia & Pacific (excluding high income)East Asia & Pacific (IDA & IBRD countries)EcuadorEgypt, Arab Rep.El SalvadorEquatorial GuineaEritreaEstoniaEthiopiaEuro areaEurope & Central AsiaEurope & Central Asia (excluding high income)Europe & Central Asia (IDA & IBRD countries)European UnionFaroe IslandsFijiFinlandFragile and conflict affected situationsFranceFrench PolynesiaGabonGambia, TheGeorgiaGermanyGhanaGreeceGreenlandGrenadaGuatemalaGuineaGuinea-BissauGuyanaHaitiHeavily indebted poor countries (HIPC)High incomeHondurasHong Kong SAR, ChinaHungaryIBRD onlyIcelandIDA & IBRD totalIDA blendIDA onlyIDA totalIndiaIndonesiaIran, Islamic Rep.IraqIrelandIsraelItalyJamaicaJapanJordanKazakhstanKenyaKiribatiKorea, Rep.KuwaitKyrgyz RepublicLao PDRLate-demographic dividendLatin America & Caribbean Latin America & Caribbean (excluding high income)Latin America & the Caribbean (IDA & IBRD countries)LatviaLeast developed countries: UN classificationLebanonLesothoLiberiaLibyaLithuaniaLow & middle incomeLow incomeLower middle incomeLuxembourgMacao SAR, ChinaMacedonia, FYRMadagascarMalawiMalaysiaMaldivesMaliMaltaMauritaniaMauritiusMexicoMiddle East & North AfricaMiddle East & North Africa (excluding high income)Middle East & North Africa (IDA & IBRD countries)Middle incomeMoldovaMongoliaMoroccoMozambiqueMyanmarNamibiaNepalNetherlandsNew CaledoniaNew ZealandNicaraguaNigerNigeriaNorth AmericaNorwayOECD membersOmanOther small statesPacific island small statesPakistanPalauPanamaPapua New GuineaParaguayPeruPhilippinesPolandPortugalPost-demographic dividendPre-demographic dividendQatarRomaniaRussian FederationRwandaSamoaSao Tome and PrincipeSaudi ArabiaSenegalSerbiaSeychellesSierra LeoneSingaporeSlovak RepublicSloveniaSmall statesSolomon IslandsSomaliaSouth AfricaSouth AsiaSouth Asia (IDA & IBRD)SpainSri LankaSt. Kitts and NevisSt. LuciaSt. Vincent and the GrenadinesSub-Saharan Africa Sub-Saharan Africa (excluding high income)Sub-Saharan Africa (IDA & IBRD countries)SudanSurinameSwazilandSwedenSwitzerlandSyrian Arab RepublicTajikistanTanzaniaThailandTimor-LesteTogoTongaTrinidad and TobagoTunisiaTurkeyTurkmenistanTurks and Caicos IslandsTuvaluUgandaUkraineUnited Arab EmiratesUnited KingdomUnited StatesUpper middle incomeUruguayVanuatuVenezuela, RBVietnamVirgin Islands (U.S.)WorldYemen, Rep.ZambiaZimbabwe Timeline:
This timeline shows a graph from 1963 to 2016 of Thailand. No data until 1962. Number of actual observations by date: 54.
Source name:
World Development Indicators
Source organization:
World Bank staff estimates from the Comtrade database maintained by the United Nations Statistics Division.
Categories, topics:
Energy & Mining, Private Sector, Trade
Last updated:
apr 23, 2017
Indicators value changes by year
Maximum:
31.016
jan 1, 1983
At the date of observation
Value
Absolute change
Change from previous value
jan 1, 1963
10.782
+10.782
0.0%
jan 1, 1964
9.648
-1.134
-10.52%
jan 1, 1965
10.307
+0.659
6.83%
jan 1, 1966
8.506
-1.801
-17.47%
jan 1, 1967
9.13
+0.624
7.34%
jan 1, 1968
7.207
-1.924
-21.07%
jan 1, 1969
8.341
+1.134
15.74%
jan 1, 1970
6.838
-1.503
-18.02%
jan 1, 1971
8.75
+1.912
27.96%
jan 1, 1972
10.424
+1.674
19.14%
jan 1, 1973
10.236
-0.188
-1.8%
jan 1, 1974
11.255
+1.018
9.95%
jan 1, 1975
19.82
+8.565
76.1%
jan 1, 1976
21.587
+1.767
8.92%
jan 1, 1977
23.296
+1.709
7.92%
jan 1, 1978
22.243
-1.052
-4.52%
jan 1, 1979
21.258
-0.985
-4.43%
jan 1, 1980
22.507
+1.249
5.88%
jan 1, 1981
30.432
+7.925
35.21%
jan 1, 1982
29.78
-0.652
-2.14%
jan 1, 1983
31.016
+1.237
4.15%
jan 1, 1984
24.207
-6.809
-21.95%
jan 1, 1985
23.494
-0.713
-2.94%
jan 1, 1986
22.66
-0.834
-3.55%
jan 1, 1987
13.483
-9.178
-40.5%
jan 1, 1988
13.348
-0.135
-1.0%
jan 1, 1989
7.695
-5.652
-42.35%
jan 1, 1990
9.146
+1.45
18.85%
jan 1, 1991
9.35
+0.204
2.23%
jan 1, 1992
9.289
-0.061
-0.65%
jan 1, 1993
8.246
-1.043
-11.23%
jan 1, 1994
7.522
-0.723
-8.77%
jan 1, 1995
6.853
-0.67
-8.9%
jan 1, 1996
6.798
-0.055
-0.8%
jan 1, 1997
8.821
+2.023
29.77%
jan 1, 1998
9.322
+0.501
5.68%
jan 1, 1999
8.175
-1.147
-12.31%
jan 1, 2000
9.685
+1.51
18.47%
jan 1, 2001
12.437
+2.752
28.41%
jan 1, 2002
12.401
-0.036
-0.29%
jan 1, 2003
11.866
-0.535
-4.31%
jan 1, 2004
12.168
+0.302
2.55%
jan 1, 2005
14.255
+2.087
17.15%
jan 1, 2006
17.859
+3.604
25.28%
jan 1, 2007
20.23
+2.371
13.28%
jan 1, 2008
18.199
-2.031
-10.04%
jan 1, 2009
21.419
+3.22
17.69%
jan 1, 2010
19.128
-2.291
-10.69%
jan 1, 2011
18.085
-1.043
-5.45%
jan 1, 2012
20.494
+2.409
13.32%
jan 1, 2013
20.174
-0.32
-1.56%
jan 1, 2014
22.162
+1.988
9.85%
jan 1, 2015
21.798
-0.364
-1.64%
jan 1, 2016
15.634
-6.164
-28.28%
Ranking of countries by current statistics by years


Comments: