29
/
en
AIzaSyAYiBZKx7MnpbEhh9jyipgxe19OcubqV5w
April 1, 2024
154590
India
IND
true
2
1
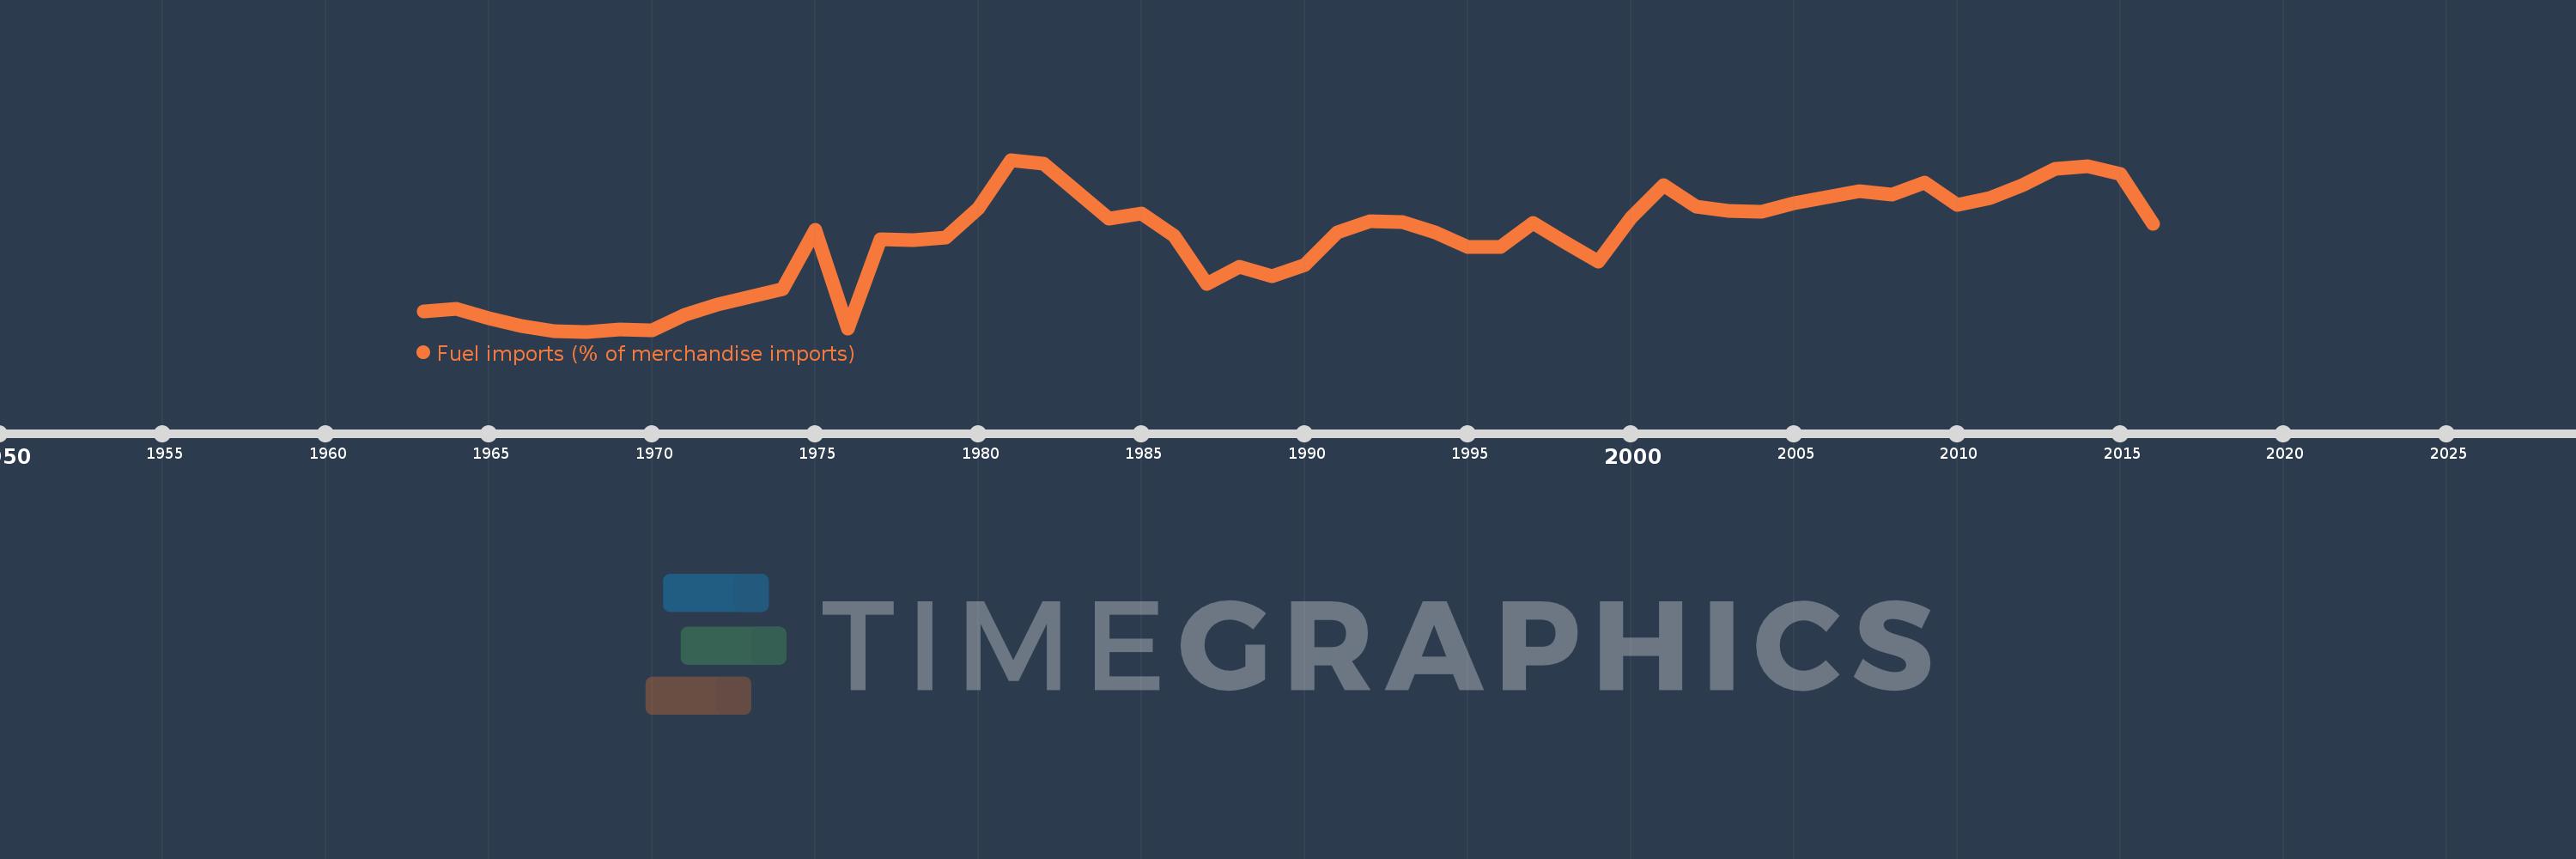
Fuel imports (% of merchandise imports)
2016,2015,2014,2013,2012,2011,2010,2009,2008,2007,2006,2005,2004,2003,2002,2001,2000,1999,1998,1997,1996,1995,1994,1993,1992,1991,1990,1989,1988,1987,1986,1985,1984,1982,1981,1980,1979,1978,1977,1976,1975,1974,1973,1972,1971,1970,1969,1968,1967,1966,1965,1964,1963
This statistics in other country:
AfghanistanAlbaniaAlgeriaAndorraAngolaAntigua and BarbudaArab WorldArgentinaArmeniaArubaAustraliaAustriaAzerbaijanBahamas, TheBahrainBangladeshBarbadosBelarusBelgiumBelizeBeninBermudaBhutanBoliviaBosnia and HerzegovinaBotswanaBrazilBrunei DarussalamBulgariaBurkina FasoBurundiCabo VerdeCambodiaCameroonCanadaCaribbean small statesCayman IslandsCentral African RepublicCentral Europe and the BalticsChadChileChinaColombiaComorosCongo, Dem. Rep.Congo, Rep.Costa RicaCote d'IvoireCroatiaCubaCyprusCzech RepublicDenmarkDjiboutiDominicaDominican RepublicEarly-demographic dividendEast Asia & PacificEast Asia & Pacific (excluding high income)East Asia & Pacific (IDA & IBRD countries)EcuadorEgypt, Arab Rep.El SalvadorEquatorial GuineaEritreaEstoniaEthiopiaEuro areaEurope & Central AsiaEurope & Central Asia (excluding high income)Europe & Central Asia (IDA & IBRD countries)European UnionFaroe IslandsFijiFinlandFragile and conflict affected situationsFranceFrench PolynesiaGabonGambia, TheGeorgiaGermanyGhanaGreeceGreenlandGrenadaGuatemalaGuineaGuinea-BissauGuyanaHaitiHeavily indebted poor countries (HIPC)High incomeHondurasHong Kong SAR, ChinaHungaryIBRD onlyIcelandIDA & IBRD totalIDA blendIDA onlyIDA totalIndiaIndonesiaIran, Islamic Rep.IraqIrelandIsraelItalyJamaicaJapanJordanKazakhstanKenyaKiribatiKorea, Rep.KuwaitKyrgyz RepublicLao PDRLate-demographic dividendLatin America & Caribbean Latin America & Caribbean (excluding high income)Latin America & the Caribbean (IDA & IBRD countries)LatviaLeast developed countries: UN classificationLebanonLesothoLiberiaLibyaLithuaniaLow & middle incomeLow incomeLower middle incomeLuxembourgMacao SAR, ChinaMacedonia, FYRMadagascarMalawiMalaysiaMaldivesMaliMaltaMauritaniaMauritiusMexicoMiddle East & North AfricaMiddle East & North Africa (excluding high income)Middle East & North Africa (IDA & IBRD countries)Middle incomeMoldovaMongoliaMoroccoMozambiqueMyanmarNamibiaNepalNetherlandsNew CaledoniaNew ZealandNicaraguaNigerNigeriaNorth AmericaNorwayOECD membersOmanOther small statesPacific island small statesPakistanPalauPanamaPapua New GuineaParaguayPeruPhilippinesPolandPortugalPost-demographic dividendPre-demographic dividendQatarRomaniaRussian FederationRwandaSamoaSao Tome and PrincipeSaudi ArabiaSenegalSerbiaSeychellesSierra LeoneSingaporeSlovak RepublicSloveniaSmall statesSolomon IslandsSomaliaSouth AfricaSouth AsiaSouth Asia (IDA & IBRD)SpainSri LankaSt. Kitts and NevisSt. LuciaSt. Vincent and the GrenadinesSub-Saharan Africa Sub-Saharan Africa (excluding high income)Sub-Saharan Africa (IDA & IBRD countries)SudanSurinameSwazilandSwedenSwitzerlandSyrian Arab RepublicTajikistanTanzaniaThailandTimor-LesteTogoTongaTrinidad and TobagoTunisiaTurkeyTurkmenistanTurks and Caicos IslandsTuvaluUgandaUkraineUnited Arab EmiratesUnited KingdomUnited StatesUpper middle incomeUruguayVanuatuVenezuela, RBVietnamVirgin Islands (U.S.)WorldYemen, Rep.ZambiaZimbabwe Timeline:
This timeline shows a graph from 1963 to 2016 of India. No data until 1962. Number of actual observations by date: 53.
Source name:
World Development Indicators
Source organization:
World Bank staff estimates from the Comtrade database maintained by the United Nations Statistics Division.
Categories, topics:
Energy & Mining, Private Sector, Trade
Last updated:
apr 23, 2017
Indicators value changes by year
Maximum:
44.632
jan 1, 1981
At the date of observation
Value
Absolute change
Change from previous value
jan 1, 1963
8.474
+8.474
0.0%
jan 1, 1964
9.147
+0.674
7.95%
jan 1, 1965
6.937
-2.211
-24.17%
jan 1, 1966
5.036
-1.901
-27.4%
jan 1, 1967
3.851
-1.184
-23.52%
jan 1, 1968
3.71
-0.141
-3.66%
jan 1, 1969
4.322
+0.612
16.49%
jan 1, 1970
4.066
-0.256
-5.93%
jan 1, 1971
7.715
+3.648
89.73%
jan 1, 1972
10.185
+2.47
32.02%
jan 1, 1973
11.943
+1.758
17.26%
jan 1, 1974
13.873
+1.93
16.16%
jan 1, 1975
27.983
+14.11
101.71%
jan 1, 1976
4.394
-23.588
-84.3%
jan 1, 1977
25.712
+21.318
485.13%
jan 1, 1978
25.539
-0.173
-0.67%
jan 1, 1979
26.098
+0.559
2.19%
jan 1, 1980
33.173
+7.075
27.11%
jan 1, 1981
44.632
+11.459
34.54%
jan 1, 1982
43.633
-0.999
-2.24%
jan 1, 1984
30.677
-12.957
-29.69%
jan 1, 1985
31.824
+1.147
3.74%
jan 1, 1986
26.491
-5.333
-16.76%
jan 1, 1987
15.057
-11.434
-43.16%
jan 1, 1988
19.128
+4.071
27.04%
jan 1, 1989
17.003
-2.125
-11.11%
jan 1, 1990
19.519
+2.516
14.8%
jan 1, 1991
27.295
+7.776
39.84%
jan 1, 1992
29.933
+2.638
9.66%
jan 1, 1993
29.808
-0.125
-0.42%
jan 1, 1994
27.283
-2.526
-8.47%
jan 1, 1995
23.917
-3.366
-12.34%
jan 1, 1996
23.822
-0.095
-0.4%
jan 1, 1997
29.532
+5.71
23.97%
jan 1, 1998
24.899
-4.633
-15.69%
jan 1, 1999
20.358
-4.541
-18.24%
jan 1, 2000
30.839
+10.481
51.48%
jan 1, 2001
38.603
+7.764
25.18%
jan 1, 2002
33.413
-5.189
-13.44%
jan 1, 2003
32.445
-0.969
-2.9%
jan 1, 2004
32.198
-0.246
-0.76%
jan 1, 2005
34.349
+2.151
6.68%
jan 1, 2006
35.704
+1.355
3.94%
jan 1, 2007
37.234
+1.529
4.28%
jan 1, 2008
36.348
-0.886
-2.38%
jan 1, 2009
39.164
+2.816
7.75%
jan 1, 2010
33.982
-5.182
-13.23%
jan 1, 2011
35.555
+1.573
4.63%
jan 1, 2012
38.495
+2.94
8.27%
jan 1, 2013
42.554
+4.059
10.54%
jan 1, 2014
43.008
+0.454
1.07%
jan 1, 2015
41.32
-1.688
-3.93%
jan 1, 2016
29.433
-11.887
-28.77%
Ranking of countries by current statistics by years


Comments: