29
/
en
AIzaSyAYiBZKx7MnpbEhh9jyipgxe19OcubqV5w
April 1, 2024
133134
Finland
FIN
true
2
1
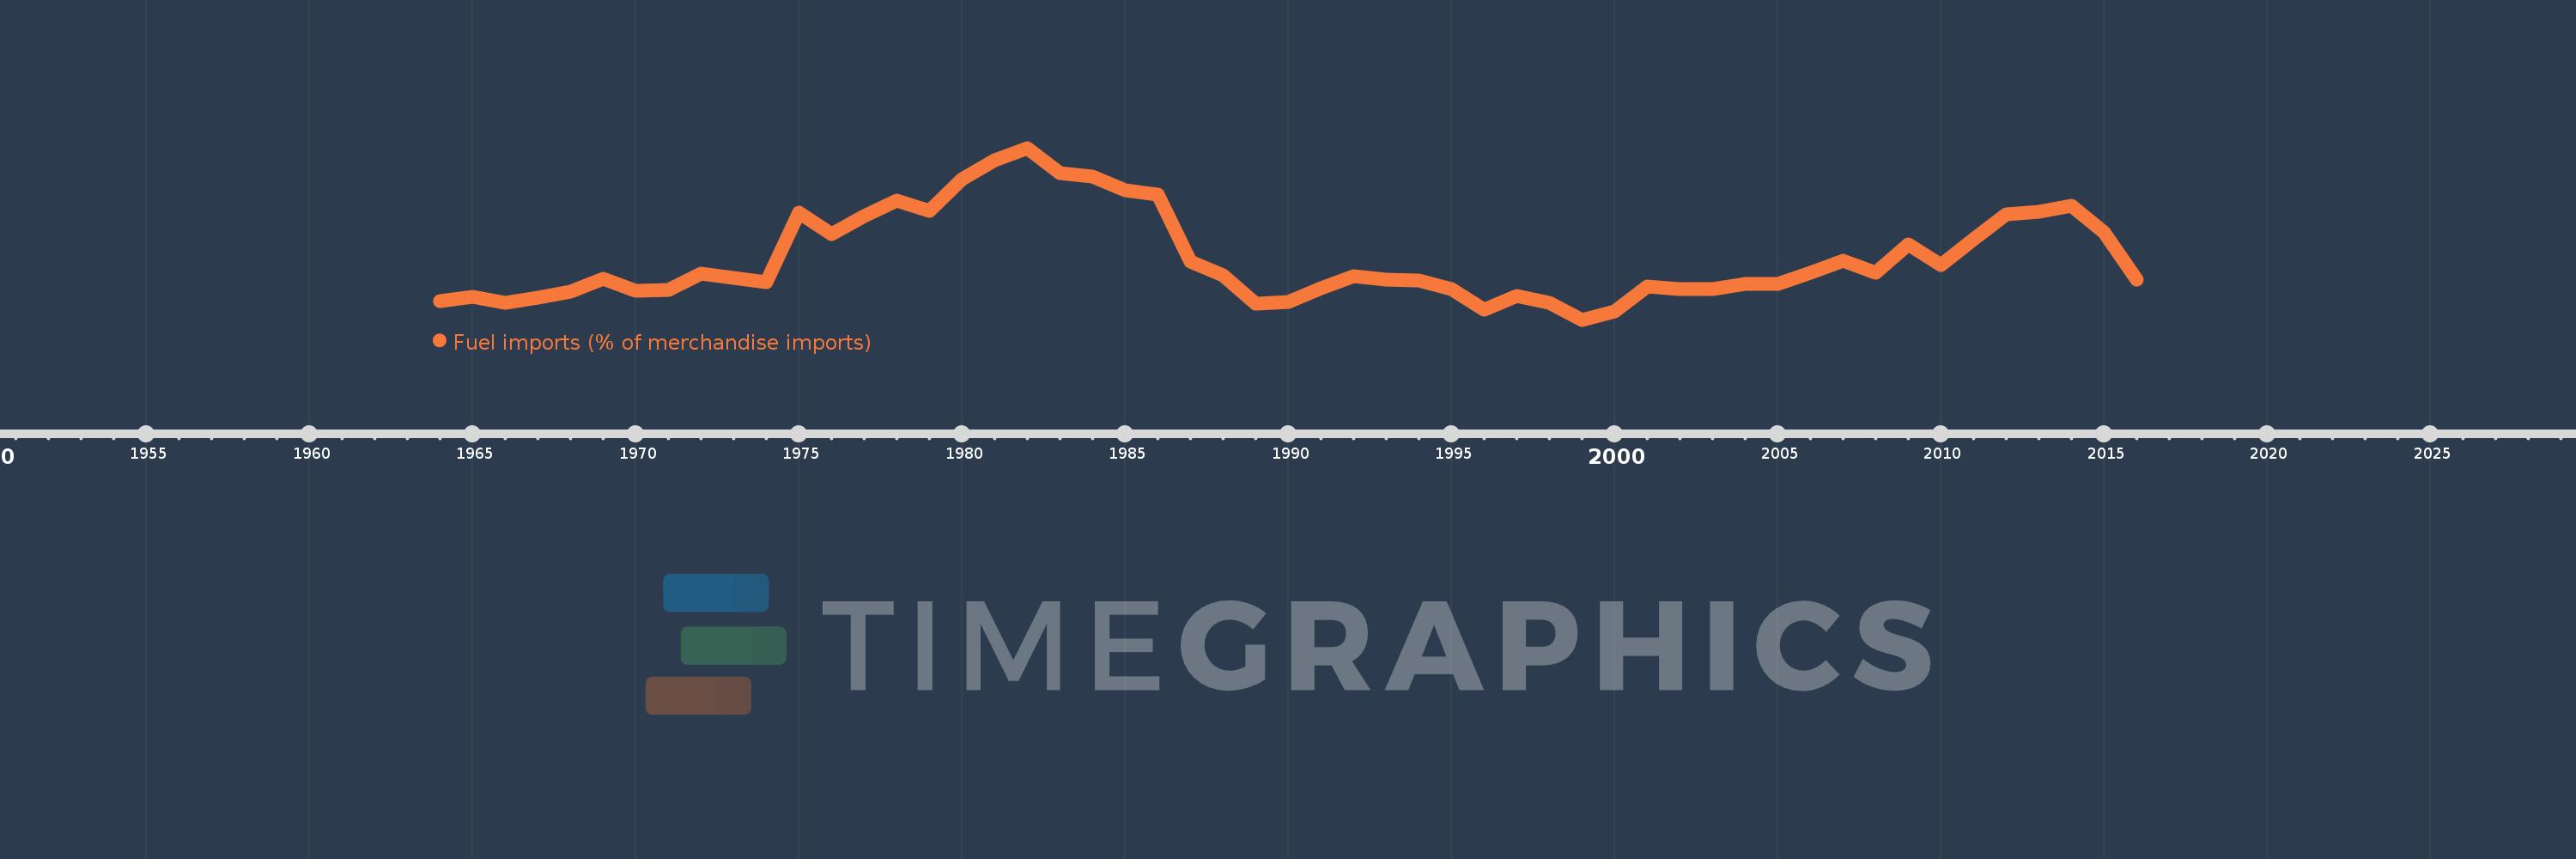
Fuel imports (% of merchandise imports)
2016,2015,2014,2013,2012,2011,2010,2009,2008,2007,2006,2005,2004,2003,2002,2001,2000,1999,1998,1997,1996,1995,1994,1993,1992,1991,1990,1989,1988,1987,1986,1985,1984,1983,1982,1981,1980,1979,1978,1977,1976,1975,1974,1973,1972,1971,1970,1969,1968,1967,1966,1965,1964
This statistics in other country:
AfghanistanAlbaniaAlgeriaAndorraAngolaAntigua and BarbudaArab WorldArgentinaArmeniaArubaAustraliaAustriaAzerbaijanBahamas, TheBahrainBangladeshBarbadosBelarusBelgiumBelizeBeninBermudaBhutanBoliviaBosnia and HerzegovinaBotswanaBrazilBrunei DarussalamBulgariaBurkina FasoBurundiCabo VerdeCambodiaCameroonCanadaCaribbean small statesCayman IslandsCentral African RepublicCentral Europe and the BalticsChadChileChinaColombiaComorosCongo, Dem. Rep.Congo, Rep.Costa RicaCote d'IvoireCroatiaCubaCyprusCzech RepublicDenmarkDjiboutiDominicaDominican RepublicEarly-demographic dividendEast Asia & PacificEast Asia & Pacific (excluding high income)East Asia & Pacific (IDA & IBRD countries)EcuadorEgypt, Arab Rep.El SalvadorEquatorial GuineaEritreaEstoniaEthiopiaEuro areaEurope & Central AsiaEurope & Central Asia (excluding high income)Europe & Central Asia (IDA & IBRD countries)European UnionFaroe IslandsFijiFinlandFragile and conflict affected situationsFranceFrench PolynesiaGabonGambia, TheGeorgiaGermanyGhanaGreeceGreenlandGrenadaGuatemalaGuineaGuinea-BissauGuyanaHaitiHeavily indebted poor countries (HIPC)High incomeHondurasHong Kong SAR, ChinaHungaryIBRD onlyIcelandIDA & IBRD totalIDA blendIDA onlyIDA totalIndiaIndonesiaIran, Islamic Rep.IraqIrelandIsraelItalyJamaicaJapanJordanKazakhstanKenyaKiribatiKorea, Rep.KuwaitKyrgyz RepublicLao PDRLate-demographic dividendLatin America & Caribbean Latin America & Caribbean (excluding high income)Latin America & the Caribbean (IDA & IBRD countries)LatviaLeast developed countries: UN classificationLebanonLesothoLiberiaLibyaLithuaniaLow & middle incomeLow incomeLower middle incomeLuxembourgMacao SAR, ChinaMacedonia, FYRMadagascarMalawiMalaysiaMaldivesMaliMaltaMauritaniaMauritiusMexicoMiddle East & North AfricaMiddle East & North Africa (excluding high income)Middle East & North Africa (IDA & IBRD countries)Middle incomeMoldovaMongoliaMoroccoMozambiqueMyanmarNamibiaNepalNetherlandsNew CaledoniaNew ZealandNicaraguaNigerNigeriaNorth AmericaNorwayOECD membersOmanOther small statesPacific island small statesPakistanPalauPanamaPapua New GuineaParaguayPeruPhilippinesPolandPortugalPost-demographic dividendPre-demographic dividendQatarRomaniaRussian FederationRwandaSamoaSao Tome and PrincipeSaudi ArabiaSenegalSerbiaSeychellesSierra LeoneSingaporeSlovak RepublicSloveniaSmall statesSolomon IslandsSomaliaSouth AfricaSouth AsiaSouth Asia (IDA & IBRD)SpainSri LankaSt. Kitts and NevisSt. LuciaSt. Vincent and the GrenadinesSub-Saharan Africa Sub-Saharan Africa (excluding high income)Sub-Saharan Africa (IDA & IBRD countries)SudanSurinameSwazilandSwedenSwitzerlandSyrian Arab RepublicTajikistanTanzaniaThailandTimor-LesteTogoTongaTrinidad and TobagoTunisiaTurkeyTurkmenistanTurks and Caicos IslandsTuvaluUgandaUkraineUnited Arab EmiratesUnited KingdomUnited StatesUpper middle incomeUruguayVanuatuVenezuela, RBVietnamVirgin Islands (U.S.)WorldYemen, Rep.ZambiaZimbabwe Timeline:
This timeline shows a graph from 1964 to 2016 of Finland. No data until 1963. Number of actual observations by date: 53.
Source name:
World Development Indicators
Source organization:
World Bank staff estimates from the Comtrade database maintained by the United Nations Statistics Division.
Categories, topics:
Energy & Mining, Private Sector, Trade
Last updated:
apr 23, 2017
Indicators value changes by year
Maximum:
30.704
jan 1, 1982
At the date of observation
Value
Absolute change
Change from previous value
jan 1, 1964
9.993
+9.993
0.0%
jan 1, 1965
10.597
+0.604
6.04%
jan 1, 1966
9.679
-0.918
-8.67%
jan 1, 1967
10.425
+0.746
7.7%
jan 1, 1968
11.251
+0.826
7.93%
jan 1, 1969
13.033
+1.782
15.84%
jan 1, 1970
11.326
-1.707
-13.1%
jan 1, 1971
11.463
+0.137
1.21%
jan 1, 1972
13.711
+2.248
19.61%
jan 1, 1973
13.135
-0.576
-4.2%
jan 1, 1974
12.525
-0.61
-4.64%
jan 1, 1975
21.959
+9.434
75.32%
jan 1, 1976
19.043
-2.916
-13.28%
jan 1, 1977
21.452
+2.409
12.65%
jan 1, 1978
23.576
+2.124
9.9%
jan 1, 1979
22.206
-1.369
-5.81%
jan 1, 1980
26.494
+4.288
19.31%
jan 1, 1981
29.078
+2.584
9.75%
jan 1, 1982
30.704
+1.626
5.59%
jan 1, 1983
27.308
-3.396
-11.06%
jan 1, 1984
26.885
-0.423
-1.55%
jan 1, 1985
24.939
-1.946
-7.24%
jan 1, 1986
24.334
-0.605
-2.43%
jan 1, 1987
15.3
-9.034
-37.13%
jan 1, 1988
13.452
-1.847
-12.08%
jan 1, 1989
9.626
-3.826
-28.44%
jan 1, 1990
9.886
+0.259
2.7%
jan 1, 1991
11.747
+1.861
18.83%
jan 1, 1992
13.372
+1.625
13.83%
jan 1, 1993
12.922
-0.45
-3.36%
jan 1, 1994
12.787
-0.136
-1.05%
jan 1, 1995
11.585
-1.201
-9.4%
jan 1, 1996
8.831
-2.755
-23.78%
jan 1, 1997
10.598
+1.767
20.01%
jan 1, 1998
9.688
-0.91
-8.58%
jan 1, 1999
7.433
-2.255
-23.27%
jan 1, 2000
8.526
+1.093
14.7%
jan 1, 2001
11.915
+3.388
39.74%
jan 1, 2002
11.635
-0.279
-2.34%
jan 1, 2003
11.597
-0.038
-0.33%
jan 1, 2004
12.254
+0.657
5.66%
jan 1, 2005
12.251
-0.003
-0.02%
jan 1, 2006
13.763
+1.511
12.34%
jan 1, 2007
15.394
+1.631
11.85%
jan 1, 2008
13.819
-1.574
-10.23%
jan 1, 2009
17.661
+3.841
27.8%
jan 1, 2010
14.888
-2.773
-15.7%
jan 1, 2011
18.38
+3.492
23.46%
jan 1, 2012
21.767
+3.387
18.43%
jan 1, 2013
22.035
+0.268
1.23%
jan 1, 2014
22.901
+0.865
3.93%
jan 1, 2015
19.26
-3.641
-15.9%
jan 1, 2016
12.857
-6.403
-33.25%
Ranking of countries by current statistics by years


Comments: