29
/
en
AIzaSyAYiBZKx7MnpbEhh9jyipgxe19OcubqV5w
April 1, 2024
72963
Australia
AUS
true
2
1
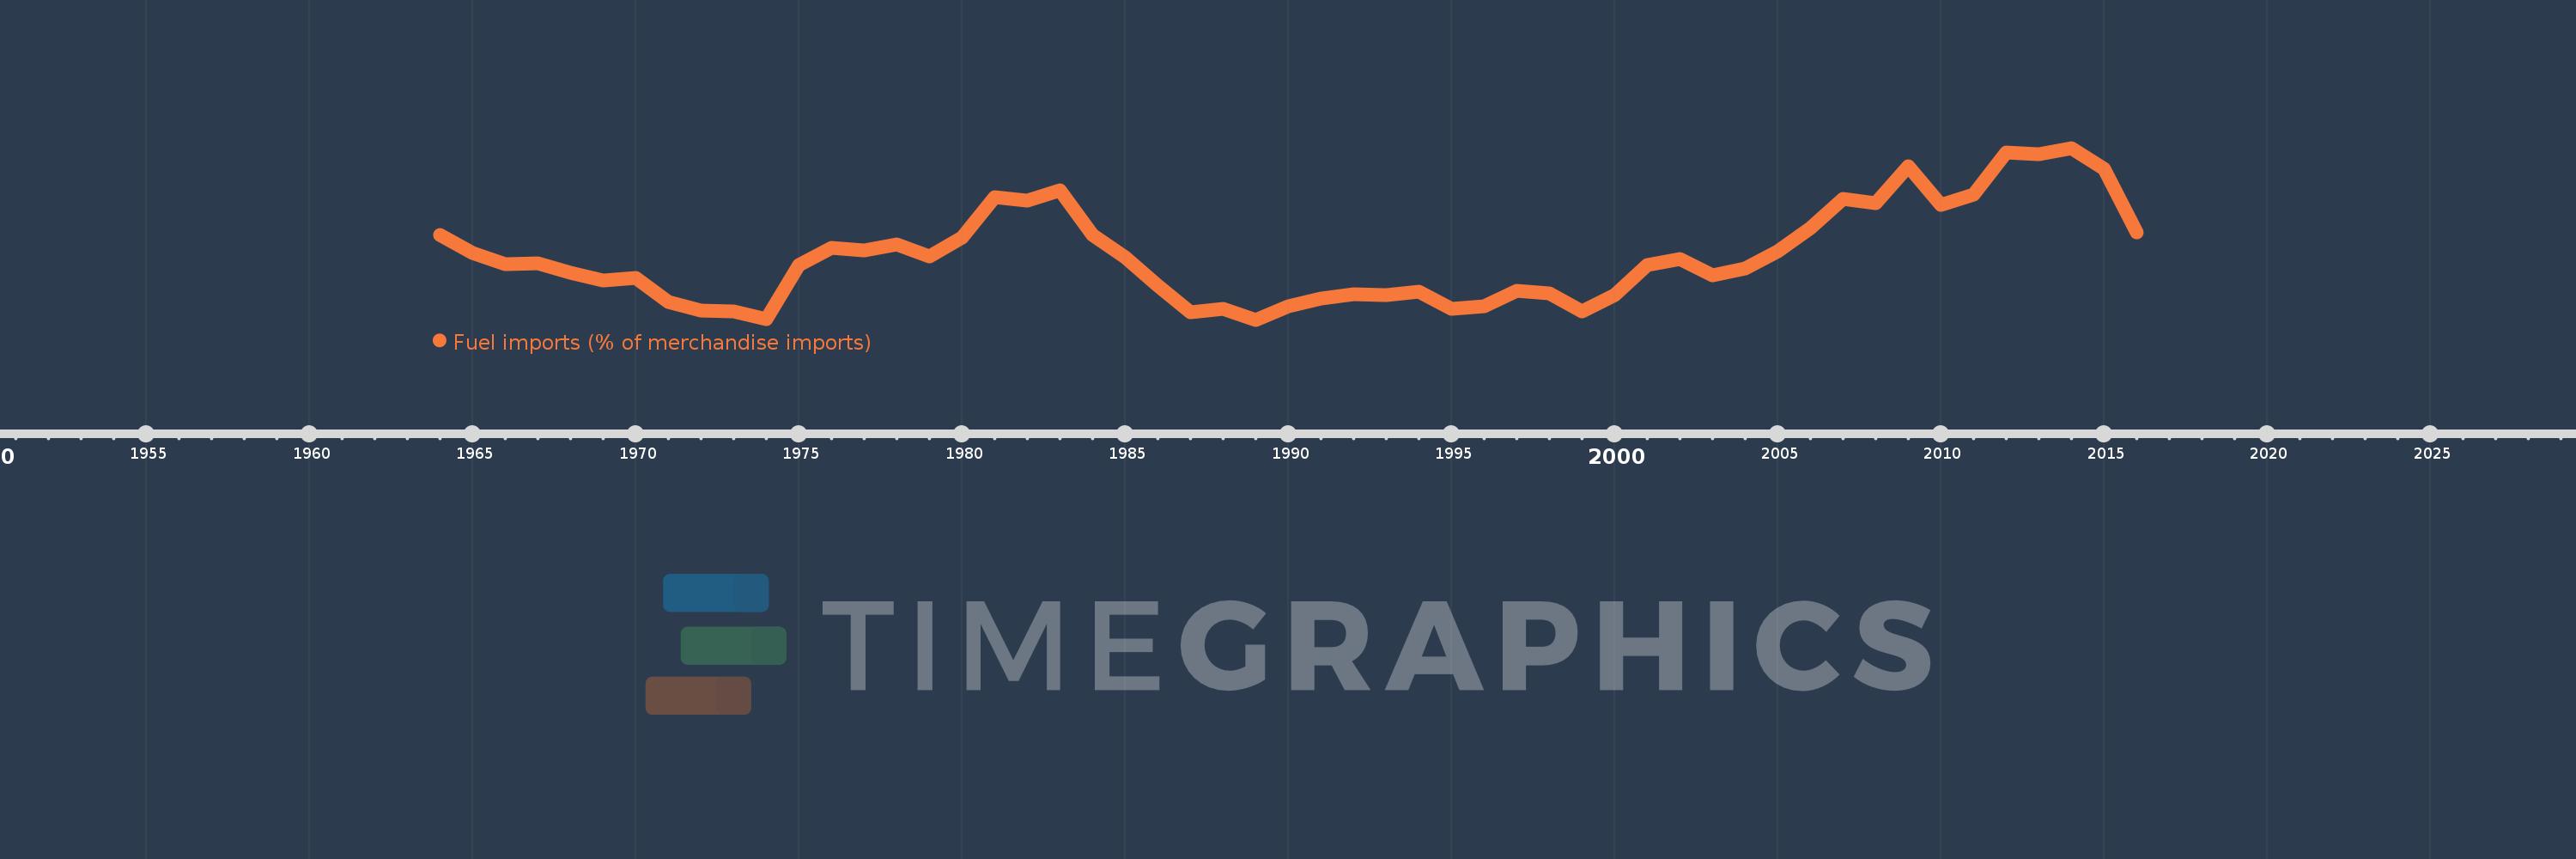
Fuel imports (% of merchandise imports)
2016,2015,2014,2013,2012,2011,2010,2009,2008,2007,2006,2005,2004,2003,2002,2001,2000,1999,1998,1997,1996,1995,1994,1993,1992,1991,1990,1989,1988,1987,1986,1985,1984,1983,1982,1981,1980,1979,1978,1977,1976,1975,1974,1973,1972,1971,1970,1969,1968,1967,1966,1965,1964
This statistics in other country:
AfghanistanAlbaniaAlgeriaAndorraAngolaAntigua and BarbudaArab WorldArgentinaArmeniaArubaAustraliaAustriaAzerbaijanBahamas, TheBahrainBangladeshBarbadosBelarusBelgiumBelizeBeninBermudaBhutanBoliviaBosnia and HerzegovinaBotswanaBrazilBrunei DarussalamBulgariaBurkina FasoBurundiCabo VerdeCambodiaCameroonCanadaCaribbean small statesCayman IslandsCentral African RepublicCentral Europe and the BalticsChadChileChinaColombiaComorosCongo, Dem. Rep.Congo, Rep.Costa RicaCote d'IvoireCroatiaCubaCyprusCzech RepublicDenmarkDjiboutiDominicaDominican RepublicEarly-demographic dividendEast Asia & PacificEast Asia & Pacific (excluding high income)East Asia & Pacific (IDA & IBRD countries)EcuadorEgypt, Arab Rep.El SalvadorEquatorial GuineaEritreaEstoniaEthiopiaEuro areaEurope & Central AsiaEurope & Central Asia (excluding high income)Europe & Central Asia (IDA & IBRD countries)European UnionFaroe IslandsFijiFinlandFragile and conflict affected situationsFranceFrench PolynesiaGabonGambia, TheGeorgiaGermanyGhanaGreeceGreenlandGrenadaGuatemalaGuineaGuinea-BissauGuyanaHaitiHeavily indebted poor countries (HIPC)High incomeHondurasHong Kong SAR, ChinaHungaryIBRD onlyIcelandIDA & IBRD totalIDA blendIDA onlyIDA totalIndiaIndonesiaIran, Islamic Rep.IraqIrelandIsraelItalyJamaicaJapanJordanKazakhstanKenyaKiribatiKorea, Rep.KuwaitKyrgyz RepublicLao PDRLate-demographic dividendLatin America & Caribbean Latin America & Caribbean (excluding high income)Latin America & the Caribbean (IDA & IBRD countries)LatviaLeast developed countries: UN classificationLebanonLesothoLiberiaLibyaLithuaniaLow & middle incomeLow incomeLower middle incomeLuxembourgMacao SAR, ChinaMacedonia, FYRMadagascarMalawiMalaysiaMaldivesMaliMaltaMauritaniaMauritiusMexicoMiddle East & North AfricaMiddle East & North Africa (excluding high income)Middle East & North Africa (IDA & IBRD countries)Middle incomeMoldovaMongoliaMoroccoMozambiqueMyanmarNamibiaNepalNetherlandsNew CaledoniaNew ZealandNicaraguaNigerNigeriaNorth AmericaNorwayOECD membersOmanOther small statesPacific island small statesPakistanPalauPanamaPapua New GuineaParaguayPeruPhilippinesPolandPortugalPost-demographic dividendPre-demographic dividendQatarRomaniaRussian FederationRwandaSamoaSao Tome and PrincipeSaudi ArabiaSenegalSerbiaSeychellesSierra LeoneSingaporeSlovak RepublicSloveniaSmall statesSolomon IslandsSomaliaSouth AfricaSouth AsiaSouth Asia (IDA & IBRD)SpainSri LankaSt. Kitts and NevisSt. LuciaSt. Vincent and the GrenadinesSub-Saharan Africa Sub-Saharan Africa (excluding high income)Sub-Saharan Africa (IDA & IBRD countries)SudanSurinameSwazilandSwedenSwitzerlandSyrian Arab RepublicTajikistanTanzaniaThailandTimor-LesteTogoTongaTrinidad and TobagoTunisiaTurkeyTurkmenistanTurks and Caicos IslandsTuvaluUgandaUkraineUnited Arab EmiratesUnited KingdomUnited StatesUpper middle incomeUruguayVanuatuVenezuela, RBVietnamVirgin Islands (U.S.)WorldYemen, Rep.ZambiaZimbabwe Timeline:
This timeline shows a graph from 1964 to 2016 of Australia. No data until 1963. Number of actual observations by date: 53.
Source name:
World Development Indicators
Source organization:
World Bank staff estimates from the Comtrade database maintained by the United Nations Statistics Division.
Categories, topics:
Energy & Mining, Private Sector, Trade
Last updated:
apr 23, 2017
Indicators value changes by year
Maximum:
17.803
jan 1, 2014
At the date of observation
Value
Absolute change
Change from previous value
jan 1, 1964
10.848
+10.848
0.0%
jan 1, 1965
9.346
-1.502
-13.85%
jan 1, 1966
8.455
-0.892
-9.54%
jan 1, 1967
8.539
+0.084
1.0%
jan 1, 1968
7.818
-0.721
-8.44%
jan 1, 1969
7.152
-0.665
-8.51%
jan 1, 1970
7.38
+0.228
3.18%
jan 1, 1971
5.465
-1.915
-25.95%
jan 1, 1972
4.762
-0.703
-12.87%
jan 1, 1973
4.692
-0.07
-1.47%
jan 1, 1974
4.1
-0.592
-12.61%
jan 1, 1975
8.414
+4.314
105.21%
jan 1, 1976
9.768
+1.354
16.09%
jan 1, 1977
9.563
-0.205
-2.1%
jan 1, 1978
10.083
+0.52
5.44%
jan 1, 1979
9.09
-0.993
-9.85%
jan 1, 1980
10.649
+1.559
17.15%
jan 1, 1981
13.832
+3.184
29.9%
jan 1, 1982
13.593
-0.239
-1.73%
jan 1, 1983
14.435
+0.842
6.19%
jan 1, 1984
10.828
-3.606
-24.98%
jan 1, 1985
9.013
-1.816
-16.77%
jan 1, 1986
6.757
-2.256
-25.03%
jan 1, 1987
4.622
-2.134
-31.59%
jan 1, 1988
4.868
+0.246
5.33%
jan 1, 1989
4.021
-0.847
-17.4%
jan 1, 1990
5.136
+1.115
27.72%
jan 1, 1991
5.695
+0.559
10.88%
jan 1, 1992
6.042
+0.347
6.09%
jan 1, 1993
5.981
-0.062
-1.02%
jan 1, 1994
6.24
+0.26
4.34%
jan 1, 1995
4.883
-1.358
-21.76%
jan 1, 1996
5.114
+0.231
4.73%
jan 1, 1997
6.339
+1.225
23.96%
jan 1, 1998
6.128
-0.211
-3.33%
jan 1, 1999
4.68
-1.447
-23.62%
jan 1, 2000
6.022
+1.341
28.65%
jan 1, 2001
8.421
+2.399
39.84%
jan 1, 2002
8.922
+0.501
5.95%
jan 1, 2003
7.559
-1.362
-15.27%
jan 1, 2004
8.137
+0.577
7.64%
jan 1, 2005
9.495
+1.359
16.7%
jan 1, 2006
11.375
+1.879
19.79%
jan 1, 2007
13.711
+2.337
20.54%
jan 1, 2008
13.389
-0.323
-2.36%
jan 1, 2009
16.312
+2.924
21.84%
jan 1, 2010
13.263
-3.05
-18.7%
jan 1, 2011
14.036
+0.773
5.83%
jan 1, 2012
17.432
+3.397
24.2%
jan 1, 2013
17.302
-0.13
-0.75%
jan 1, 2014
17.803
+0.501
2.9%
jan 1, 2015
16.11
-1.693
-9.51%
jan 1, 2016
11.058
-5.052
-31.36%
Ranking of countries by current statistics by years


Comments: