29
/
en
AIzaSyAYiBZKx7MnpbEhh9jyipgxe19OcubqV5w
April 1, 2024
220824
Paraguay
PRY
true
2
1
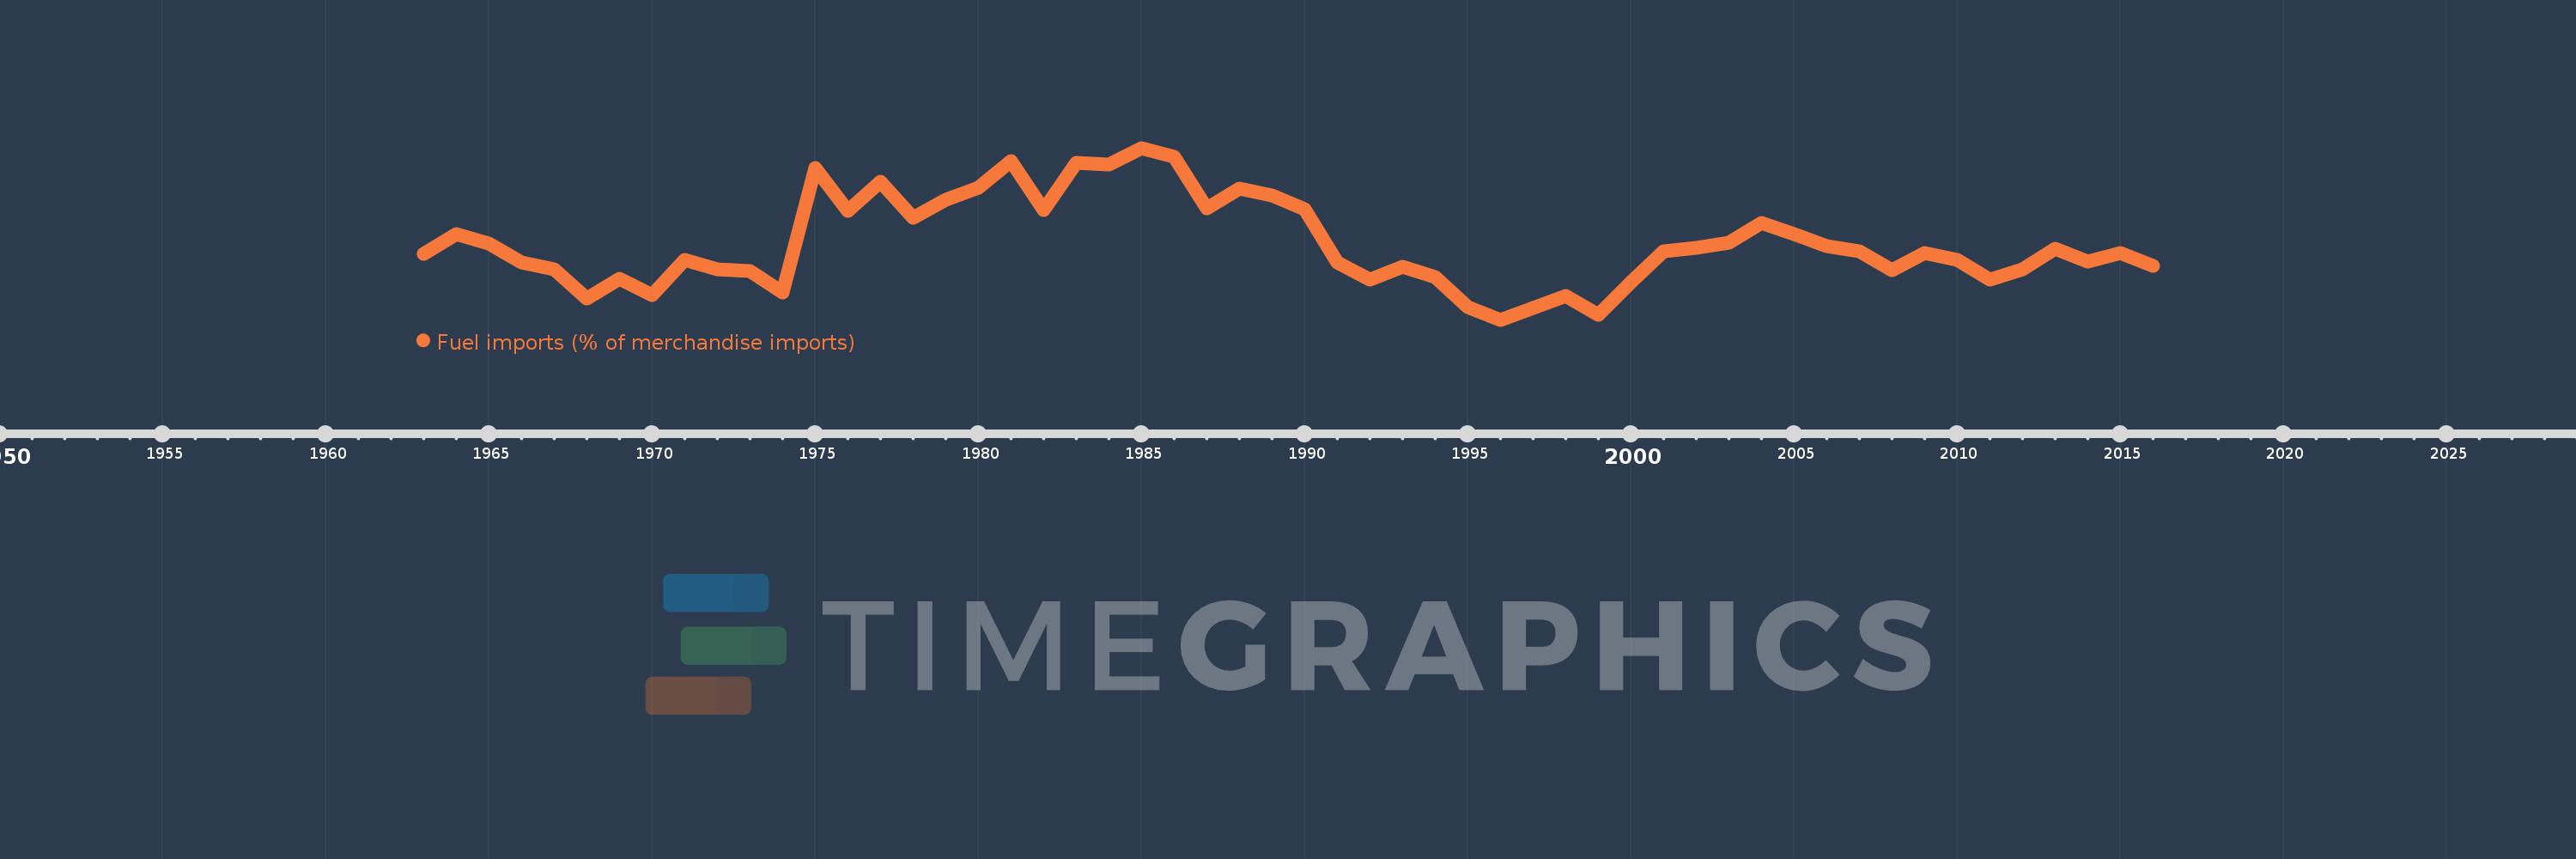
Fuel imports (% of merchandise imports)
2016,2015,2014,2013,2012,2011,2010,2009,2008,2007,2006,2005,2004,2003,2002,2001,2000,1999,1998,1997,1996,1995,1994,1993,1992,1991,1990,1989,1988,1987,1986,1985,1984,1983,1982,1981,1980,1979,1978,1977,1976,1975,1974,1973,1972,1971,1970,1969,1968,1967,1966,1965,1964,1963
This statistics in other country:
AfghanistanAlbaniaAlgeriaAndorraAngolaAntigua and BarbudaArab WorldArgentinaArmeniaArubaAustraliaAustriaAzerbaijanBahamas, TheBahrainBangladeshBarbadosBelarusBelgiumBelizeBeninBermudaBhutanBoliviaBosnia and HerzegovinaBotswanaBrazilBrunei DarussalamBulgariaBurkina FasoBurundiCabo VerdeCambodiaCameroonCanadaCaribbean small statesCayman IslandsCentral African RepublicCentral Europe and the BalticsChadChileChinaColombiaComorosCongo, Dem. Rep.Congo, Rep.Costa RicaCote d'IvoireCroatiaCubaCyprusCzech RepublicDenmarkDjiboutiDominicaDominican RepublicEarly-demographic dividendEast Asia & PacificEast Asia & Pacific (excluding high income)East Asia & Pacific (IDA & IBRD countries)EcuadorEgypt, Arab Rep.El SalvadorEquatorial GuineaEritreaEstoniaEthiopiaEuro areaEurope & Central AsiaEurope & Central Asia (excluding high income)Europe & Central Asia (IDA & IBRD countries)European UnionFaroe IslandsFijiFinlandFragile and conflict affected situationsFranceFrench PolynesiaGabonGambia, TheGeorgiaGermanyGhanaGreeceGreenlandGrenadaGuatemalaGuineaGuinea-BissauGuyanaHaitiHeavily indebted poor countries (HIPC)High incomeHondurasHong Kong SAR, ChinaHungaryIBRD onlyIcelandIDA & IBRD totalIDA blendIDA onlyIDA totalIndiaIndonesiaIran, Islamic Rep.IraqIrelandIsraelItalyJamaicaJapanJordanKazakhstanKenyaKiribatiKorea, Rep.KuwaitKyrgyz RepublicLao PDRLate-demographic dividendLatin America & Caribbean Latin America & Caribbean (excluding high income)Latin America & the Caribbean (IDA & IBRD countries)LatviaLeast developed countries: UN classificationLebanonLesothoLiberiaLibyaLithuaniaLow & middle incomeLow incomeLower middle incomeLuxembourgMacao SAR, ChinaMacedonia, FYRMadagascarMalawiMalaysiaMaldivesMaliMaltaMauritaniaMauritiusMexicoMiddle East & North AfricaMiddle East & North Africa (excluding high income)Middle East & North Africa (IDA & IBRD countries)Middle incomeMoldovaMongoliaMoroccoMozambiqueMyanmarNamibiaNepalNetherlandsNew CaledoniaNew ZealandNicaraguaNigerNigeriaNorth AmericaNorwayOECD membersOmanOther small statesPacific island small statesPakistanPalauPanamaPapua New GuineaParaguayPeruPhilippinesPolandPortugalPost-demographic dividendPre-demographic dividendQatarRomaniaRussian FederationRwandaSamoaSao Tome and PrincipeSaudi ArabiaSenegalSerbiaSeychellesSierra LeoneSingaporeSlovak RepublicSloveniaSmall statesSolomon IslandsSomaliaSouth AfricaSouth AsiaSouth Asia (IDA & IBRD)SpainSri LankaSt. Kitts and NevisSt. LuciaSt. Vincent and the GrenadinesSub-Saharan Africa Sub-Saharan Africa (excluding high income)Sub-Saharan Africa (IDA & IBRD countries)SudanSurinameSwazilandSwedenSwitzerlandSyrian Arab RepublicTajikistanTanzaniaThailandTimor-LesteTogoTongaTrinidad and TobagoTunisiaTurkeyTurkmenistanTurks and Caicos IslandsTuvaluUgandaUkraineUnited Arab EmiratesUnited KingdomUnited StatesUpper middle incomeUruguayVanuatuVenezuela, RBVietnamVirgin Islands (U.S.)WorldYemen, Rep.ZambiaZimbabwe Timeline:
This timeline shows a graph from 1963 to 2016 of Paraguay. No data until 1962. Number of actual observations by date: 54.
Source name:
World Development Indicators
Source organization:
World Bank staff estimates from the Comtrade database maintained by the United Nations Statistics Division.
Categories, topics:
Energy & Mining, Private Sector, Trade
Last updated:
apr 23, 2017
Indicators value changes by year
Maximum:
29.445
jan 1, 1985
At the date of observation
Value
Absolute change
Change from previous value
jan 1, 1963
15.3
+15.3
0.0%
jan 1, 1964
18.031
+2.731
17.85%
jan 1, 1965
16.681
-1.349
-7.48%
jan 1, 1966
14.183
-2.499
-14.98%
jan 1, 1967
13.255
-0.928
-6.54%
jan 1, 1968
9.456
-3.799
-28.66%
jan 1, 1969
11.99
+2.534
26.8%
jan 1, 1970
9.9
-2.09
-17.43%
jan 1, 1971
14.524
+4.624
46.71%
jan 1, 1972
13.307
-1.217
-8.38%
jan 1, 1973
13.067
-0.24
-1.81%
jan 1, 1974
10.241
-2.826
-21.63%
jan 1, 1975
26.736
+16.494
161.05%
jan 1, 1976
21.038
-5.697
-21.31%
jan 1, 1977
24.919
+3.881
18.45%
jan 1, 1978
20.182
-4.737
-19.01%
jan 1, 1979
22.543
+2.361
11.7%
jan 1, 1980
24.109
+1.566
6.95%
jan 1, 1981
27.71
+3.601
14.94%
jan 1, 1982
21.184
-6.527
-23.55%
jan 1, 1983
27.516
+6.332
29.89%
jan 1, 1984
27.208
-0.308
-1.12%
jan 1, 1985
29.445
+2.237
8.22%
jan 1, 1986
28.302
-1.142
-3.88%
jan 1, 1987
21.456
-6.846
-24.19%
jan 1, 1988
24.014
+2.558
11.92%
jan 1, 1989
23.077
-0.937
-3.9%
jan 1, 1990
21.268
-1.809
-7.84%
jan 1, 1991
14.251
-7.017
-33.0%
jan 1, 1992
11.932
-2.319
-16.27%
jan 1, 1993
13.649
+1.717
14.39%
jan 1, 1994
12.23
-1.419
-10.39%
jan 1, 1995
8.314
-3.916
-32.02%
jan 1, 1996
6.576
-1.738
-20.91%
jan 1, 1997
8.12
+1.544
23.49%
jan 1, 1998
9.771
+1.65
20.32%
jan 1, 1999
7.212
-2.559
-26.19%
jan 1, 2000
11.584
+4.372
60.62%
jan 1, 2001
15.647
+4.063
35.08%
jan 1, 2002
16.103
+0.456
2.92%
jan 1, 2003
16.833
+0.73
4.53%
jan 1, 2004
19.502
+2.669
15.85%
jan 1, 2005
17.922
-1.58
-8.1%
jan 1, 2006
16.43
-1.492
-8.32%
jan 1, 2007
15.707
-0.723
-4.4%
jan 1, 2008
13.175
-2.532
-16.12%
jan 1, 2009
15.491
+2.317
17.58%
jan 1, 2010
14.536
-0.956
-6.17%
jan 1, 2011
11.921
-2.615
-17.99%
jan 1, 2012
13.317
+1.396
11.71%
jan 1, 2013
16.012
+2.695
20.24%
jan 1, 2014
14.282
-1.73
-10.8%
jan 1, 2015
15.439
+1.157
8.1%
jan 1, 2016
13.707
-1.732
-11.22%
Ranking of countries by current statistics by years


Comments: