29
/
en
AIzaSyAYiBZKx7MnpbEhh9jyipgxe19OcubqV5w
April 1, 2024
152520
Hungary
HUN
true
2
1
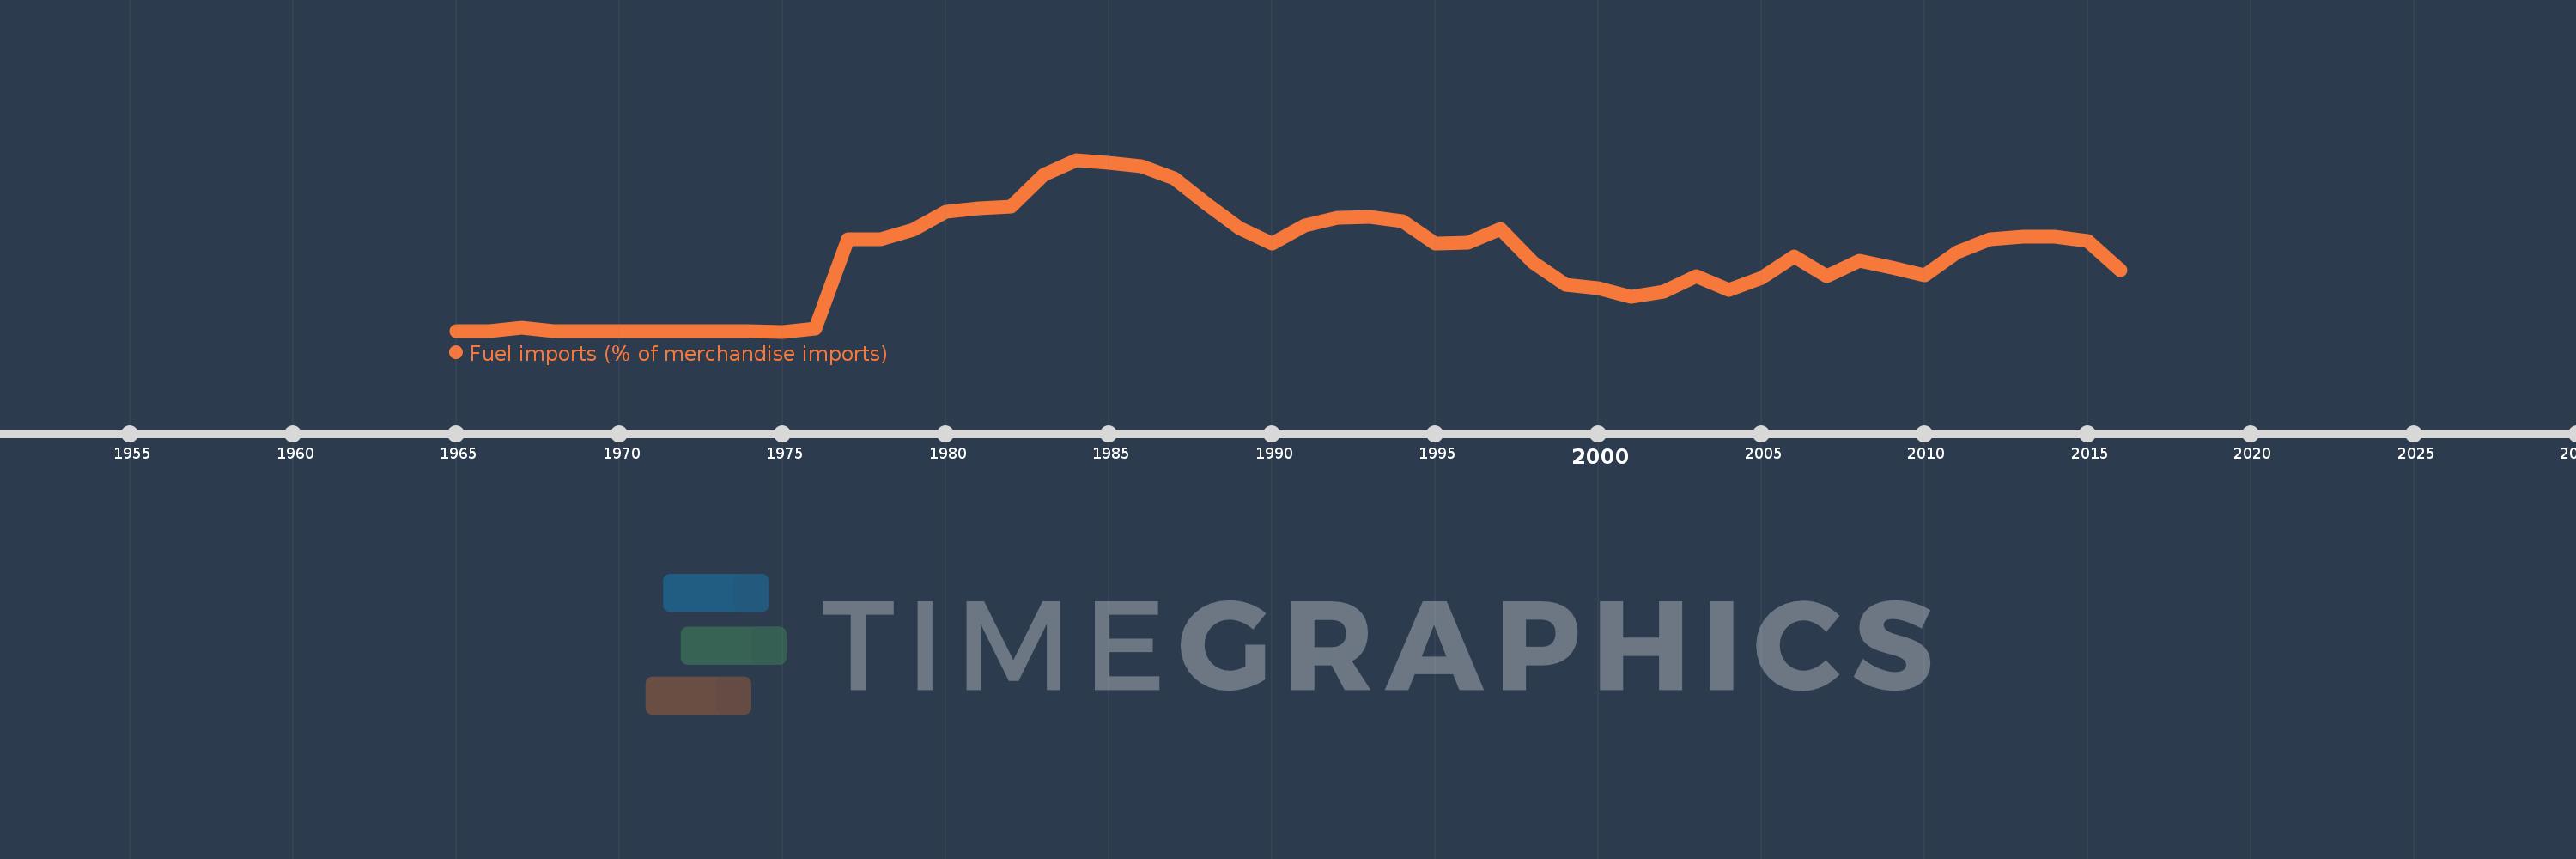
Fuel imports (% of merchandise imports)
2016,2015,2014,2013,2012,2011,2010,2009,2008,2007,2006,2005,2004,2003,2002,2001,2000,1999,1998,1997,1996,1995,1994,1993,1992,1991,1990,1989,1988,1987,1986,1985,1984,1983,1982,1981,1980,1979,1978,1977,1976,1975,1974,1973,1972,1971,1970,1969,1968,1967,1966,1965
This statistics in other country:
AfghanistanAlbaniaAlgeriaAndorraAngolaAntigua and BarbudaArab WorldArgentinaArmeniaArubaAustraliaAustriaAzerbaijanBahamas, TheBahrainBangladeshBarbadosBelarusBelgiumBelizeBeninBermudaBhutanBoliviaBosnia and HerzegovinaBotswanaBrazilBrunei DarussalamBulgariaBurkina FasoBurundiCabo VerdeCambodiaCameroonCanadaCaribbean small statesCayman IslandsCentral African RepublicCentral Europe and the BalticsChadChileChinaColombiaComorosCongo, Dem. Rep.Congo, Rep.Costa RicaCote d'IvoireCroatiaCubaCyprusCzech RepublicDenmarkDjiboutiDominicaDominican RepublicEarly-demographic dividendEast Asia & PacificEast Asia & Pacific (excluding high income)East Asia & Pacific (IDA & IBRD countries)EcuadorEgypt, Arab Rep.El SalvadorEquatorial GuineaEritreaEstoniaEthiopiaEuro areaEurope & Central AsiaEurope & Central Asia (excluding high income)Europe & Central Asia (IDA & IBRD countries)European UnionFaroe IslandsFijiFinlandFragile and conflict affected situationsFranceFrench PolynesiaGabonGambia, TheGeorgiaGermanyGhanaGreeceGreenlandGrenadaGuatemalaGuineaGuinea-BissauGuyanaHaitiHeavily indebted poor countries (HIPC)High incomeHondurasHong Kong SAR, ChinaHungaryIBRD onlyIcelandIDA & IBRD totalIDA blendIDA onlyIDA totalIndiaIndonesiaIran, Islamic Rep.IraqIrelandIsraelItalyJamaicaJapanJordanKazakhstanKenyaKiribatiKorea, Rep.KuwaitKyrgyz RepublicLao PDRLate-demographic dividendLatin America & Caribbean Latin America & Caribbean (excluding high income)Latin America & the Caribbean (IDA & IBRD countries)LatviaLeast developed countries: UN classificationLebanonLesothoLiberiaLibyaLithuaniaLow & middle incomeLow incomeLower middle incomeLuxembourgMacao SAR, ChinaMacedonia, FYRMadagascarMalawiMalaysiaMaldivesMaliMaltaMauritaniaMauritiusMexicoMiddle East & North AfricaMiddle East & North Africa (excluding high income)Middle East & North Africa (IDA & IBRD countries)Middle incomeMoldovaMongoliaMoroccoMozambiqueMyanmarNamibiaNepalNetherlandsNew CaledoniaNew ZealandNicaraguaNigerNigeriaNorth AmericaNorwayOECD membersOmanOther small statesPacific island small statesPakistanPalauPanamaPapua New GuineaParaguayPeruPhilippinesPolandPortugalPost-demographic dividendPre-demographic dividendQatarRomaniaRussian FederationRwandaSamoaSao Tome and PrincipeSaudi ArabiaSenegalSerbiaSeychellesSierra LeoneSingaporeSlovak RepublicSloveniaSmall statesSolomon IslandsSomaliaSouth AfricaSouth AsiaSouth Asia (IDA & IBRD)SpainSri LankaSt. Kitts and NevisSt. LuciaSt. Vincent and the GrenadinesSub-Saharan Africa Sub-Saharan Africa (excluding high income)Sub-Saharan Africa (IDA & IBRD countries)SudanSurinameSwazilandSwedenSwitzerlandSyrian Arab RepublicTajikistanTanzaniaThailandTimor-LesteTogoTongaTrinidad and TobagoTunisiaTurkeyTurkmenistanTurks and Caicos IslandsTuvaluUgandaUkraineUnited Arab EmiratesUnited KingdomUnited StatesUpper middle incomeUruguayVanuatuVenezuela, RBVietnamVirgin Islands (U.S.)WorldYemen, Rep.ZambiaZimbabwe Timeline:
This timeline shows a graph from 1965 to 2016 of Hungary. No data until 1964. Number of actual observations by date: 52.
Source name:
World Development Indicators
Source organization:
World Bank staff estimates from the Comtrade database maintained by the United Nations Statistics Division.
Categories, topics:
Energy & Mining, Private Sector, Trade
Last updated:
apr 23, 2017
Indicators value changes by year
Maximum:
22.866
jan 1, 1984
At the date of observation
Value
Absolute change
Change from previous value
jan 1, 1965
0.187
+0.187
0.0%
jan 1, 1966
0.17
-0.017
-9.21%
jan 1, 1967
0.656
+0.487
286.23%
jan 1, 1968
0.148
-0.508
-77.39%
jan 1, 1969
0.157
+0.009
5.98%
jan 1, 1970
0.194
+0.037
23.56%
jan 1, 1971
0.171
-0.024
-12.18%
jan 1, 1972
0.161
-0.009
-5.46%
jan 1, 1973
0.173
+0.012
7.15%
jan 1, 1974
0.188
+0.015
8.58%
jan 1, 1975
0.147
-0.041
-21.68%
jan 1, 1976
0.563
+0.416
282.69%
jan 1, 1977
12.387
+11.824
2.1K%
jan 1, 1978
12.336
-0.05
-0.41%
jan 1, 1979
13.591
+1.255
10.17%
jan 1, 1980
15.984
+2.393
17.61%
jan 1, 1981
16.42
+0.436
2.73%
jan 1, 1982
16.64
+0.22
1.34%
jan 1, 1983
20.86
+4.221
25.36%
jan 1, 1984
22.866
+2.006
9.62%
jan 1, 1985
22.524
-0.342
-1.5%
jan 1, 1986
22.033
-0.491
-2.18%
jan 1, 1987
20.374
-1.659
-7.53%
jan 1, 1988
16.996
-3.378
-16.58%
jan 1, 1989
13.819
-3.177
-18.69%
jan 1, 1990
11.753
-2.066
-14.95%
jan 1, 1991
14.214
+2.461
20.94%
jan 1, 1992
15.172
+0.957
6.74%
jan 1, 1993
15.332
+0.161
1.06%
jan 1, 1994
14.736
-0.597
-3.89%
jan 1, 1995
11.841
-2.894
-19.64%
jan 1, 1996
11.928
+0.087
0.73%
jan 1, 1997
13.755
+1.827
15.32%
jan 1, 1998
9.235
-4.52
-32.86%
jan 1, 1999
6.351
-2.884
-31.23%
jan 1, 2000
5.864
-0.486
-7.66%
jan 1, 2001
4.771
-1.093
-18.65%
jan 1, 2002
5.437
+0.666
13.95%
jan 1, 2003
7.442
+2.006
36.9%
jan 1, 2004
5.643
-1.8
-24.18%
jan 1, 2005
7.299
+1.657
29.36%
jan 1, 2006
10.127
+2.827
38.73%
jan 1, 2007
7.476
-2.651
-26.18%
jan 1, 2008
9.49
+2.014
26.94%
jan 1, 2009
8.563
-0.927
-9.77%
jan 1, 2010
7.55
-1.013
-11.83%
jan 1, 2011
10.673
+3.123
41.37%
jan 1, 2012
12.337
+1.664
15.59%
jan 1, 2013
12.709
+0.373
3.02%
jan 1, 2014
12.676
-0.033
-0.26%
jan 1, 2015
12.082
-0.594
-4.68%
jan 1, 2016
8.255
-3.827
-31.68%
Ranking of countries by current statistics by years


Comments: