29
/
en
AIzaSyAYiBZKx7MnpbEhh9jyipgxe19OcubqV5w
April 1, 2024
81737
Belgium
BEL
true
2
1
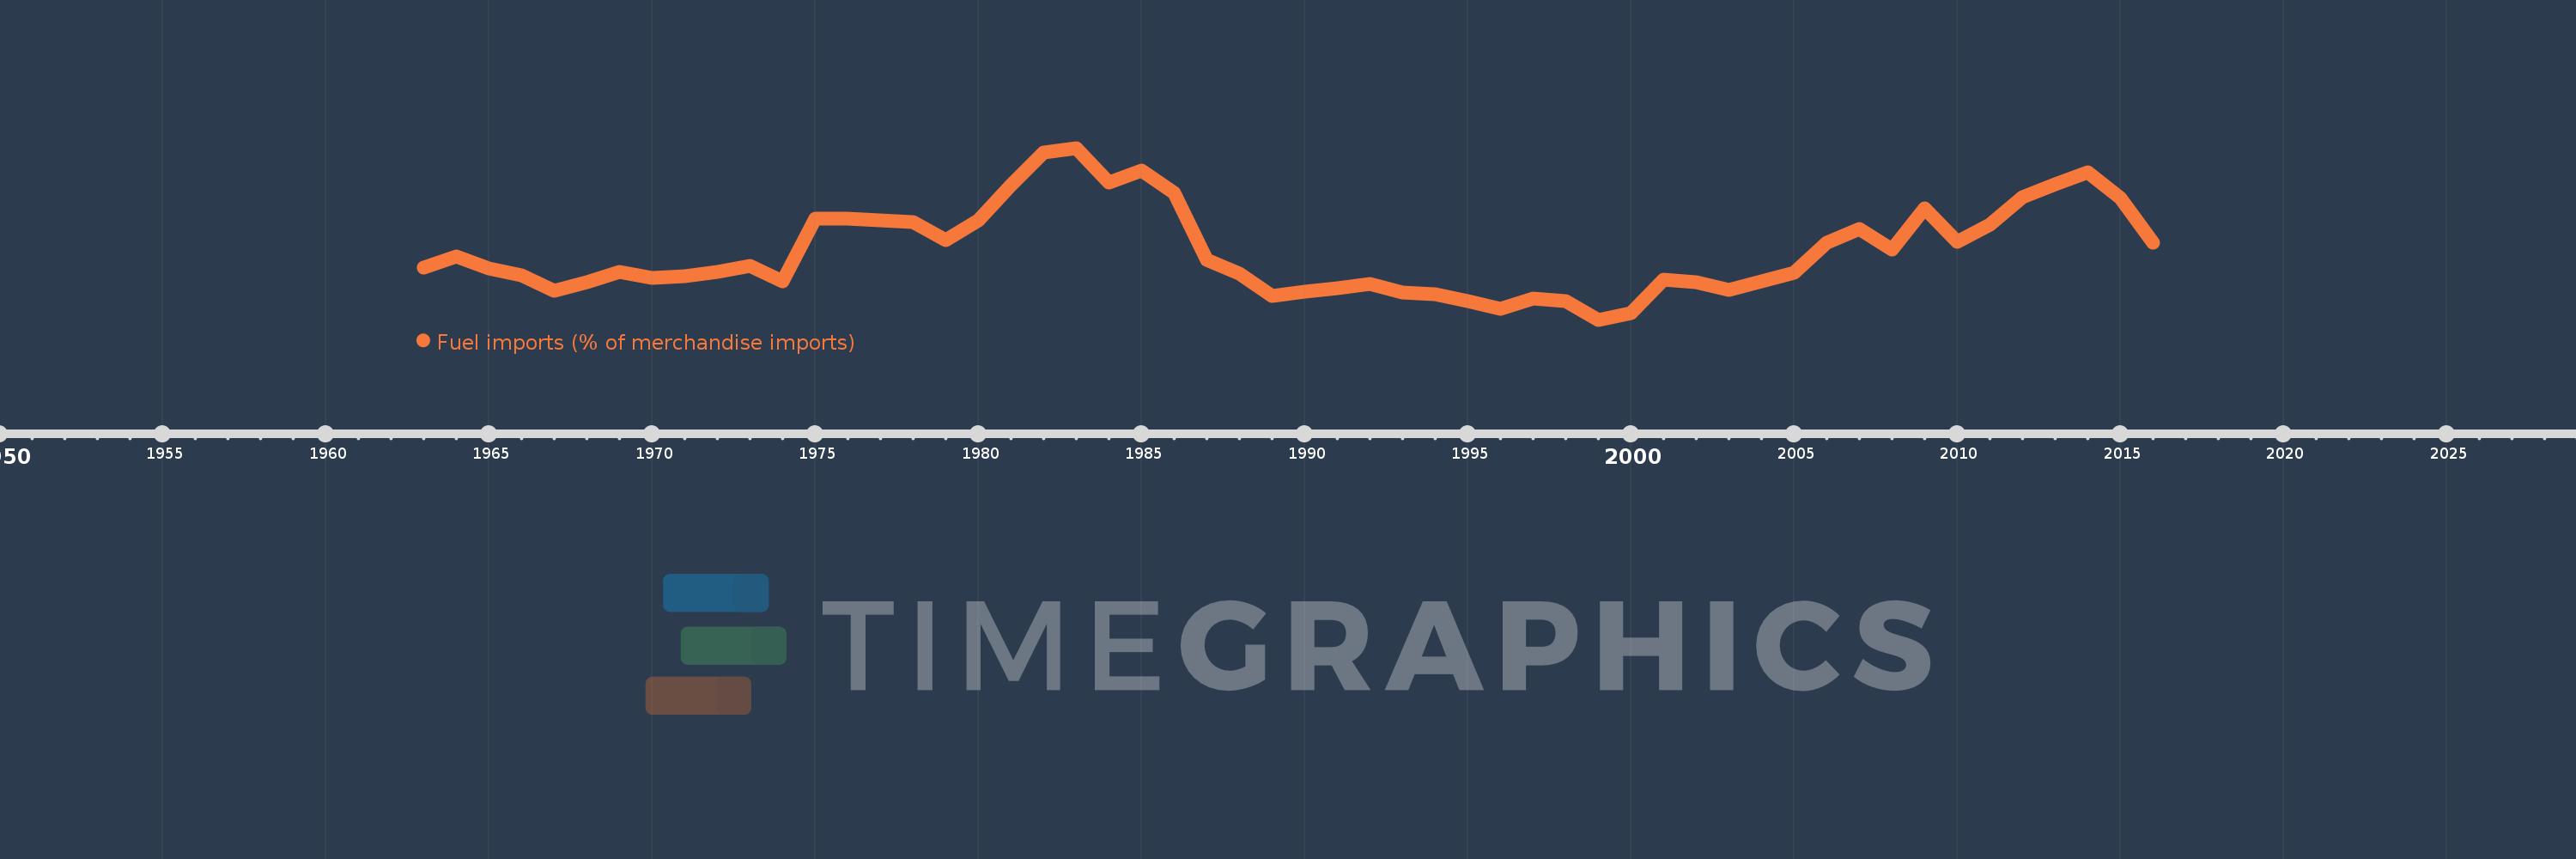
Fuel imports (% of merchandise imports)
2016,2015,2014,2013,2012,2011,2010,2009,2008,2007,2006,2005,2004,2003,2002,2001,2000,1999,1998,1997,1996,1995,1994,1993,1992,1991,1990,1989,1988,1987,1986,1985,1984,1983,1982,1981,1980,1979,1978,1977,1976,1975,1974,1973,1972,1971,1970,1969,1968,1967,1966,1965,1964,1963
This statistics in other country:
AfghanistanAlbaniaAlgeriaAndorraAngolaAntigua and BarbudaArab WorldArgentinaArmeniaArubaAustraliaAustriaAzerbaijanBahamas, TheBahrainBangladeshBarbadosBelarusBelgiumBelizeBeninBermudaBhutanBoliviaBosnia and HerzegovinaBotswanaBrazilBrunei DarussalamBulgariaBurkina FasoBurundiCabo VerdeCambodiaCameroonCanadaCaribbean small statesCayman IslandsCentral African RepublicCentral Europe and the BalticsChadChileChinaColombiaComorosCongo, Dem. Rep.Congo, Rep.Costa RicaCote d'IvoireCroatiaCubaCyprusCzech RepublicDenmarkDjiboutiDominicaDominican RepublicEarly-demographic dividendEast Asia & PacificEast Asia & Pacific (excluding high income)East Asia & Pacific (IDA & IBRD countries)EcuadorEgypt, Arab Rep.El SalvadorEquatorial GuineaEritreaEstoniaEthiopiaEuro areaEurope & Central AsiaEurope & Central Asia (excluding high income)Europe & Central Asia (IDA & IBRD countries)European UnionFaroe IslandsFijiFinlandFragile and conflict affected situationsFranceFrench PolynesiaGabonGambia, TheGeorgiaGermanyGhanaGreeceGreenlandGrenadaGuatemalaGuineaGuinea-BissauGuyanaHaitiHeavily indebted poor countries (HIPC)High incomeHondurasHong Kong SAR, ChinaHungaryIBRD onlyIcelandIDA & IBRD totalIDA blendIDA onlyIDA totalIndiaIndonesiaIran, Islamic Rep.IraqIrelandIsraelItalyJamaicaJapanJordanKazakhstanKenyaKiribatiKorea, Rep.KuwaitKyrgyz RepublicLao PDRLate-demographic dividendLatin America & Caribbean Latin America & Caribbean (excluding high income)Latin America & the Caribbean (IDA & IBRD countries)LatviaLeast developed countries: UN classificationLebanonLesothoLiberiaLibyaLithuaniaLow & middle incomeLow incomeLower middle incomeLuxembourgMacao SAR, ChinaMacedonia, FYRMadagascarMalawiMalaysiaMaldivesMaliMaltaMauritaniaMauritiusMexicoMiddle East & North AfricaMiddle East & North Africa (excluding high income)Middle East & North Africa (IDA & IBRD countries)Middle incomeMoldovaMongoliaMoroccoMozambiqueMyanmarNamibiaNepalNetherlandsNew CaledoniaNew ZealandNicaraguaNigerNigeriaNorth AmericaNorwayOECD membersOmanOther small statesPacific island small statesPakistanPalauPanamaPapua New GuineaParaguayPeruPhilippinesPolandPortugalPost-demographic dividendPre-demographic dividendQatarRomaniaRussian FederationRwandaSamoaSao Tome and PrincipeSaudi ArabiaSenegalSerbiaSeychellesSierra LeoneSingaporeSlovak RepublicSloveniaSmall statesSolomon IslandsSomaliaSouth AfricaSouth AsiaSouth Asia (IDA & IBRD)SpainSri LankaSt. Kitts and NevisSt. LuciaSt. Vincent and the GrenadinesSub-Saharan Africa Sub-Saharan Africa (excluding high income)Sub-Saharan Africa (IDA & IBRD countries)SudanSurinameSwazilandSwedenSwitzerlandSyrian Arab RepublicTajikistanTanzaniaThailandTimor-LesteTogoTongaTrinidad and TobagoTunisiaTurkeyTurkmenistanTurks and Caicos IslandsTuvaluUgandaUkraineUnited Arab EmiratesUnited KingdomUnited StatesUpper middle incomeUruguayVanuatuVenezuela, RBVietnamVirgin Islands (U.S.)WorldYemen, Rep.ZambiaZimbabwe Timeline:
This timeline shows a graph from 1963 to 2016 of Belgium. No data until 1962. Number of actual observations by date: 54.
Source name:
World Development Indicators
Source organization:
World Bank staff estimates from the Comtrade database maintained by the United Nations Statistics Division.
Categories, topics:
Energy & Mining, Private Sector, Trade
Last updated:
apr 23, 2017
Indicators value changes by year
Maximum:
20.776
jan 1, 1983
At the date of observation
Value
Absolute change
Change from previous value
jan 1, 1963
9.867
+9.867
0.0%
jan 1, 1964
10.911
+1.044
10.58%
jan 1, 1965
9.819
-1.092
-10.0%
jan 1, 1966
9.191
-0.628
-6.4%
jan 1, 1967
7.811
-1.38
-15.01%
jan 1, 1968
8.577
+0.766
9.81%
jan 1, 1969
9.52
+0.943
11.0%
jan 1, 1970
8.938
-0.583
-6.12%
jan 1, 1971
9.107
+0.169
1.9%
jan 1, 1972
9.515
+0.408
4.48%
jan 1, 1973
10.049
+0.534
5.61%
jan 1, 1974
8.667
-1.382
-13.75%
jan 1, 1975
14.328
+5.661
65.32%
jan 1, 1976
14.32
-0.008
-0.06%
jan 1, 1977
14.169
-0.151
-1.05%
jan 1, 1978
14.043
-0.126
-0.89%
jan 1, 1979
12.402
-1.641
-11.68%
jan 1, 1980
14.214
+1.812
14.61%
jan 1, 1981
17.363
+3.148
22.15%
jan 1, 1982
20.39
+3.027
17.44%
jan 1, 1983
20.776
+0.386
1.89%
jan 1, 1984
17.613
-3.162
-15.22%
jan 1, 1985
18.708
+1.094
6.21%
jan 1, 1986
16.661
-2.047
-10.94%
jan 1, 1987
10.632
-6.028
-36.18%
jan 1, 1988
9.308
-1.324
-12.46%
jan 1, 1989
7.295
-2.013
-21.62%
jan 1, 1990
7.678
+0.383
5.25%
jan 1, 1991
8.038
+0.359
4.68%
jan 1, 1992
8.416
+0.379
4.71%
jan 1, 1993
7.635
-0.781
-9.28%
jan 1, 1994
7.506
-0.129
-1.69%
jan 1, 1995
6.854
-0.652
-8.68%
jan 1, 1996
6.156
-0.699
-10.19%
jan 1, 1997
7.061
+0.905
14.71%
jan 1, 1998
6.848
-0.213
-3.01%
jan 1, 1999
5.15
-1.699
-24.8%
jan 1, 2000
5.744
+0.595
11.55%
jan 1, 2001
8.837
+3.093
53.84%
jan 1, 2002
8.545
-0.293
-3.31%
jan 1, 2003
7.868
-0.677
-7.92%
jan 1, 2004
8.67
+0.802
10.19%
jan 1, 2005
9.45
+0.78
9.0%
jan 1, 2006
12.157
+2.707
28.64%
jan 1, 2007
13.404
+1.247
10.26%
jan 1, 2008
11.555
-1.849
-13.79%
jan 1, 2009
15.288
+3.733
32.31%
jan 1, 2010
12.266
-3.022
-19.77%
jan 1, 2011
13.793
+1.527
12.45%
jan 1, 2012
16.284
+2.49
18.05%
jan 1, 2013
17.472
+1.188
7.3%
jan 1, 2014
18.554
+1.082
6.19%
jan 1, 2015
16.206
-2.347
-12.65%
jan 1, 2016
12.196
-4.011
-24.75%
Ranking of countries by current statistics by years


Comments: