29
/
en
AIzaSyAYiBZKx7MnpbEhh9jyipgxe19OcubqV5w
April 1, 2024
24884
Caribbean small states
CSS
false
2
1
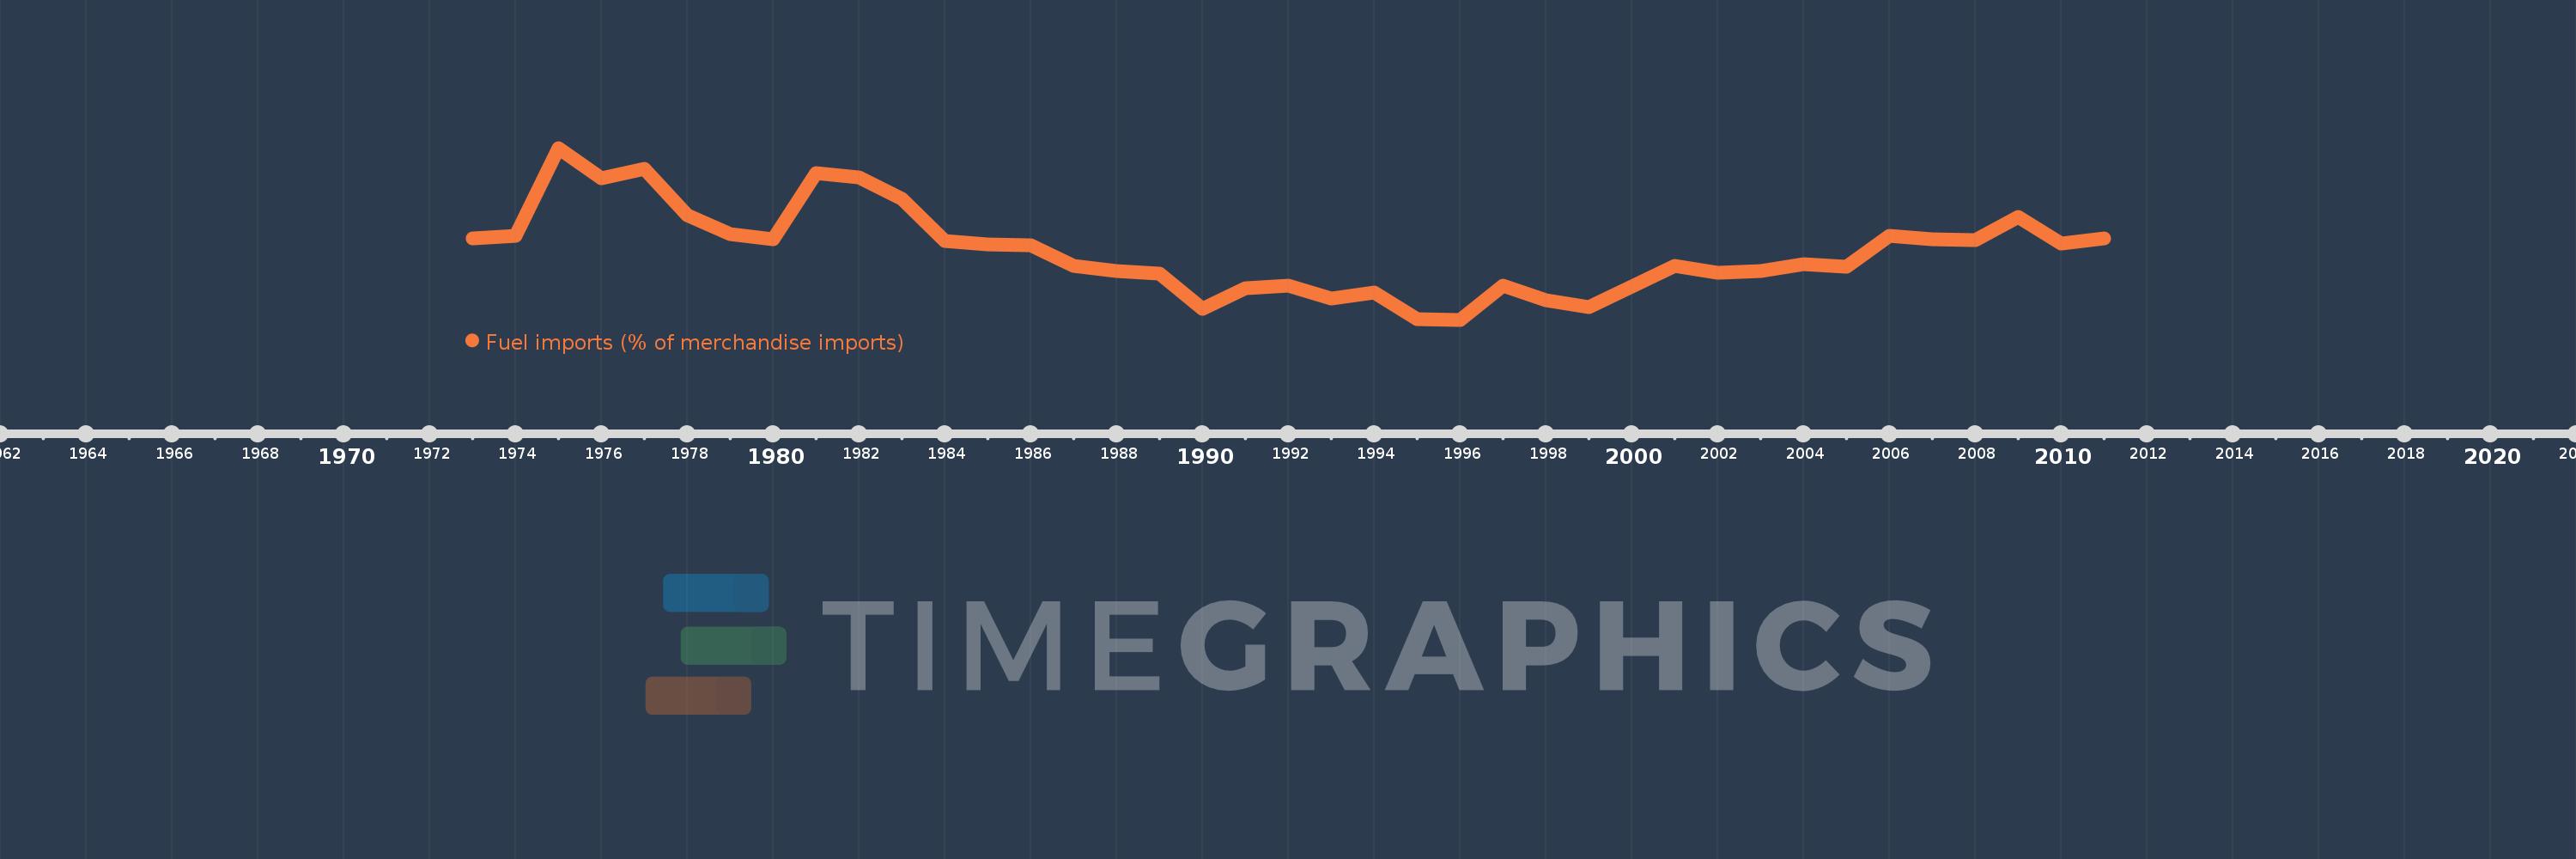
Fuel imports (% of merchandise imports)
2011,2010,2009,2008,2007,2006,2005,2004,2003,2002,2001,2000,1999,1998,1997,1996,1995,1994,1993,1992,1991,1990,1989,1988,1987,1986,1985,1984,1983,1982,1981,1980,1979,1978,1977,1976,1975,1974,1973
This statistics in other country:
AfghanistanAlbaniaAlgeriaAndorraAngolaAntigua and BarbudaArab WorldArgentinaArmeniaArubaAustraliaAustriaAzerbaijanBahamas, TheBahrainBangladeshBarbadosBelarusBelgiumBelizeBeninBermudaBhutanBoliviaBosnia and HerzegovinaBotswanaBrazilBrunei DarussalamBulgariaBurkina FasoBurundiCabo VerdeCambodiaCameroonCanadaCaribbean small statesCayman IslandsCentral African RepublicCentral Europe and the BalticsChadChileChinaColombiaComorosCongo, Dem. Rep.Congo, Rep.Costa RicaCote d'IvoireCroatiaCubaCyprusCzech RepublicDenmarkDjiboutiDominicaDominican RepublicEarly-demographic dividendEast Asia & PacificEast Asia & Pacific (excluding high income)East Asia & Pacific (IDA & IBRD countries)EcuadorEgypt, Arab Rep.El SalvadorEquatorial GuineaEritreaEstoniaEthiopiaEuro areaEurope & Central AsiaEurope & Central Asia (excluding high income)Europe & Central Asia (IDA & IBRD countries)European UnionFaroe IslandsFijiFinlandFragile and conflict affected situationsFranceFrench PolynesiaGabonGambia, TheGeorgiaGermanyGhanaGreeceGreenlandGrenadaGuatemalaGuineaGuinea-BissauGuyanaHaitiHeavily indebted poor countries (HIPC)High incomeHondurasHong Kong SAR, ChinaHungaryIBRD onlyIcelandIDA & IBRD totalIDA blendIDA onlyIDA totalIndiaIndonesiaIran, Islamic Rep.IraqIrelandIsraelItalyJamaicaJapanJordanKazakhstanKenyaKiribatiKorea, Rep.KuwaitKyrgyz RepublicLao PDRLate-demographic dividendLatin America & Caribbean Latin America & Caribbean (excluding high income)Latin America & the Caribbean (IDA & IBRD countries)LatviaLeast developed countries: UN classificationLebanonLesothoLiberiaLibyaLithuaniaLow & middle incomeLow incomeLower middle incomeLuxembourgMacao SAR, ChinaMacedonia, FYRMadagascarMalawiMalaysiaMaldivesMaliMaltaMauritaniaMauritiusMexicoMiddle East & North AfricaMiddle East & North Africa (excluding high income)Middle East & North Africa (IDA & IBRD countries)Middle incomeMoldovaMongoliaMoroccoMozambiqueMyanmarNamibiaNepalNetherlandsNew CaledoniaNew ZealandNicaraguaNigerNigeriaNorth AmericaNorwayOECD membersOmanOther small statesPacific island small statesPakistanPalauPanamaPapua New GuineaParaguayPeruPhilippinesPolandPortugalPost-demographic dividendPre-demographic dividendQatarRomaniaRussian FederationRwandaSamoaSao Tome and PrincipeSaudi ArabiaSenegalSerbiaSeychellesSierra LeoneSingaporeSlovak RepublicSloveniaSmall statesSolomon IslandsSomaliaSouth AfricaSouth AsiaSouth Asia (IDA & IBRD)SpainSri LankaSt. Kitts and NevisSt. LuciaSt. Vincent and the GrenadinesSub-Saharan Africa Sub-Saharan Africa (excluding high income)Sub-Saharan Africa (IDA & IBRD countries)SudanSurinameSwazilandSwedenSwitzerlandSyrian Arab RepublicTajikistanTanzaniaThailandTimor-LesteTogoTongaTrinidad and TobagoTunisiaTurkeyTurkmenistanTurks and Caicos IslandsTuvaluUgandaUkraineUnited Arab EmiratesUnited KingdomUnited StatesUpper middle incomeUruguayVanuatuVenezuela, RBVietnamVirgin Islands (U.S.)WorldYemen, Rep.ZambiaZimbabwe Timeline:
This timeline shows a graph from 1973 to 2011 of Caribbean small states. No data until 1972. Number of actual observations by date: 39.
Source name:
World Development Indicators
Source organization:
World Bank staff estimates from the Comtrade database maintained by the United Nations Statistics Division.
Categories, topics:
Energy & Mining, Private Sector, Trade
Last updated:
apr 23, 2017
Indicators value changes by year
Maximum:
45.896
jan 1, 1975
At the date of observation
Value
Absolute change
Change from previous value
jan 1, 1973
25.844
+25.844
0.0%
jan 1, 1974
26.4
+0.557
2.15%
jan 1, 1975
45.896
+19.496
73.85%
jan 1, 1976
39.059
-6.837
-14.9%
jan 1, 1977
41.279
+2.22
5.68%
jan 1, 1978
30.892
-10.387
-25.16%
jan 1, 1979
26.738
-4.154
-13.45%
jan 1, 1980
25.636
-1.102
-4.12%
jan 1, 1981
40.321
+14.685
57.28%
jan 1, 1982
39.341
-0.98
-2.43%
jan 1, 1983
34.594
-4.747
-12.07%
jan 1, 1984
25.264
-9.33
-26.97%
jan 1, 1985
24.463
-0.801
-3.17%
jan 1, 1986
24.316
-0.147
-0.6%
jan 1, 1987
19.579
-4.737
-19.48%
jan 1, 1988
18.553
-1.026
-5.24%
jan 1, 1989
18.027
-0.526
-2.84%
jan 1, 1990
10.208
-7.819
-43.37%
jan 1, 1991
14.62
+4.412
43.22%
jan 1, 1992
15.317
+0.698
4.77%
jan 1, 1993
12.501
-2.816
-18.39%
jan 1, 1994
13.709
+1.208
9.66%
jan 1, 1995
7.875
-5.834
-42.56%
jan 1, 1996
7.697
-0.178
-2.26%
jan 1, 1997
15.322
+7.625
99.06%
jan 1, 1998
12.073
-3.25
-21.21%
jan 1, 1999
10.499
-1.574
-13.04%
jan 1, 2000
15.176
+4.677
44.55%
jan 1, 2001
19.726
+4.55
29.98%
jan 1, 2002
18.237
-1.489
-7.55%
jan 1, 2003
18.442
+0.205
1.12%
jan 1, 2004
20.047
+1.605
8.7%
jan 1, 2005
19.528
-0.519
-2.59%
jan 1, 2006
26.373
+6.845
35.05%
jan 1, 2007
25.681
-0.692
-2.62%
jan 1, 2008
25.312
-0.369
-1.44%
jan 1, 2009
30.625
+5.313
20.99%
jan 1, 2010
24.612
-6.013
-19.63%
jan 1, 2011
25.702
+1.09
4.43%
Ranking of countries by current statistics by years


Comments: