29
/
en
AIzaSyAYiBZKx7MnpbEhh9jyipgxe19OcubqV5w
April 1, 2024
248703
Sri Lanka
LKA
true
2
1
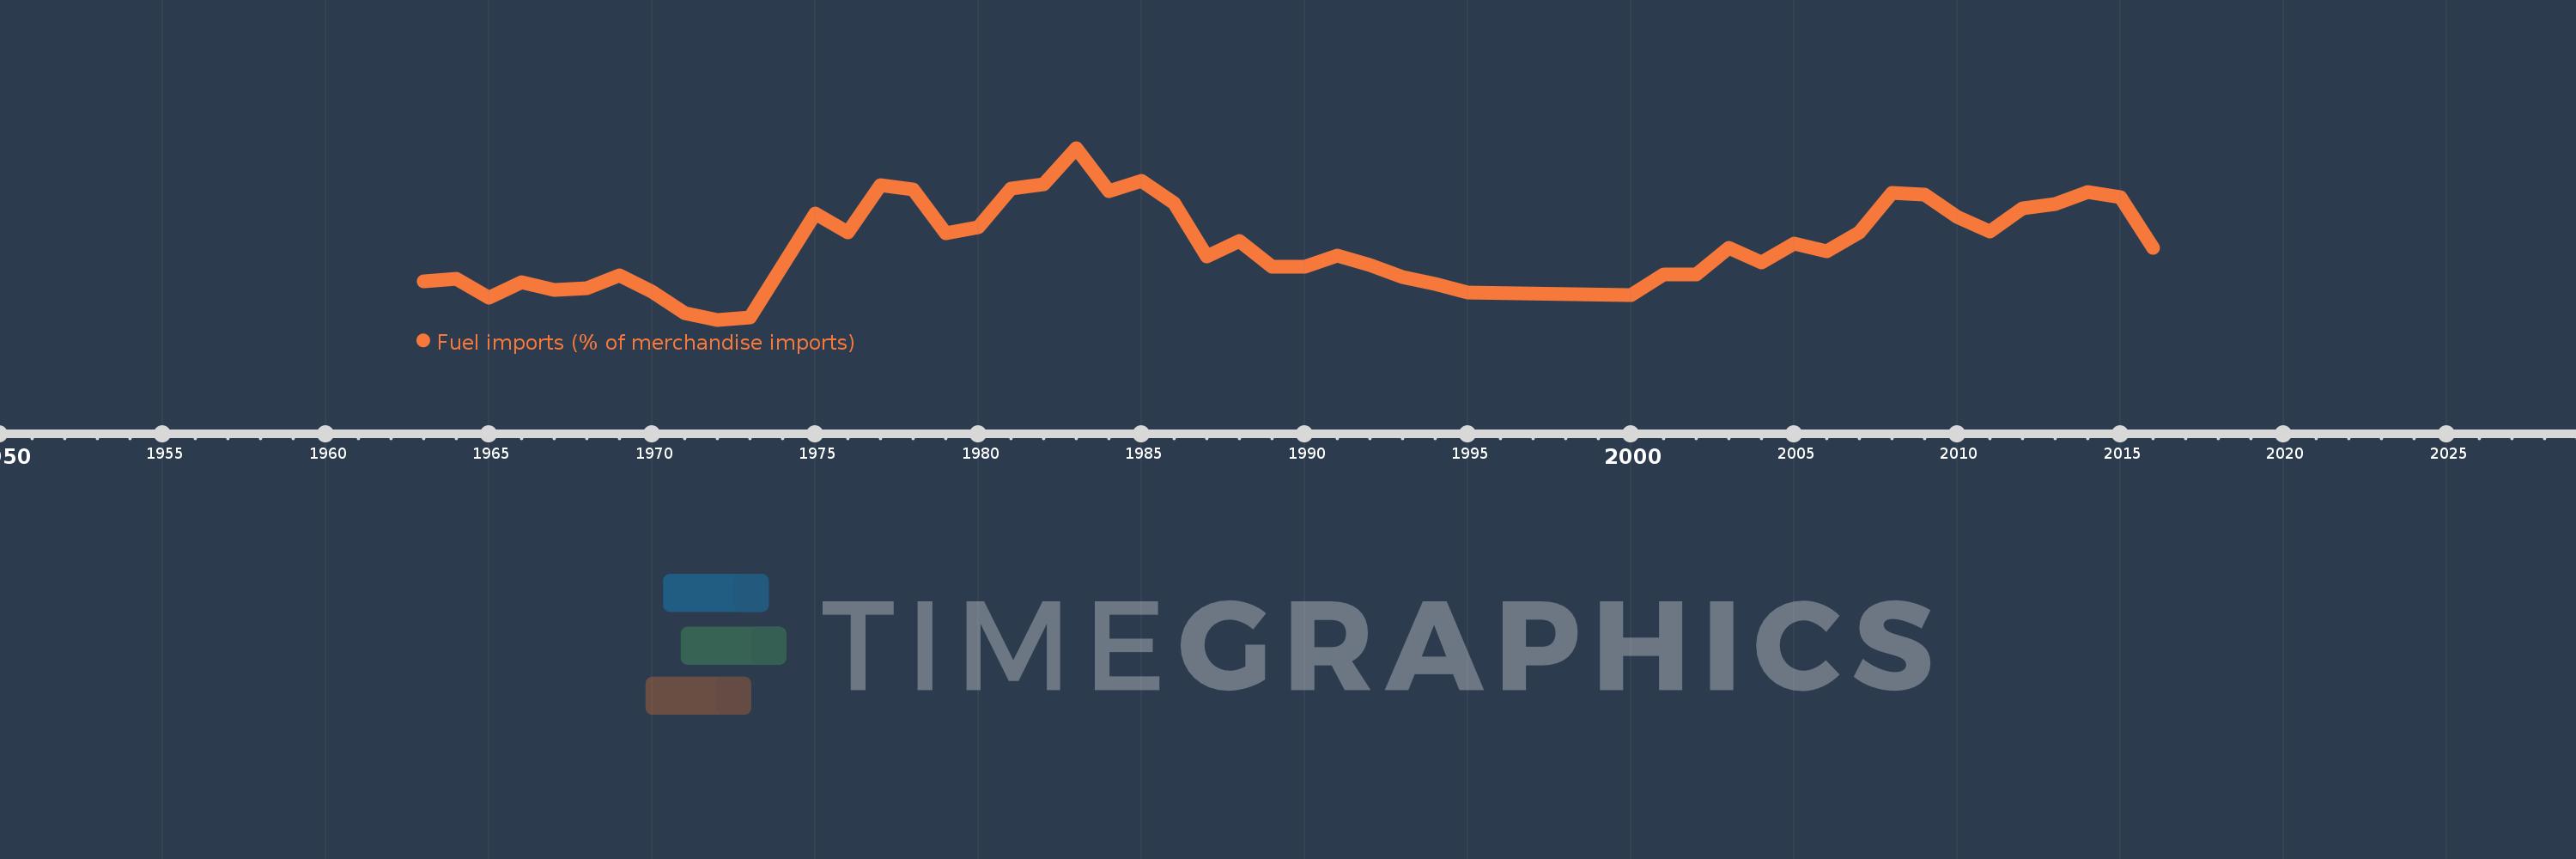
Fuel imports (% of merchandise imports)
2016,2015,2014,2013,2012,2011,2010,2009,2008,2007,2006,2005,2004,2003,2002,2001,2000,1995,1994,1993,1992,1991,1990,1989,1988,1987,1986,1985,1984,1983,1982,1981,1980,1979,1978,1977,1976,1975,1973,1972,1971,1970,1969,1968,1967,1966,1965,1964,1963
This statistics in other country:
AfghanistanAlbaniaAlgeriaAndorraAngolaAntigua and BarbudaArab WorldArgentinaArmeniaArubaAustraliaAustriaAzerbaijanBahamas, TheBahrainBangladeshBarbadosBelarusBelgiumBelizeBeninBermudaBhutanBoliviaBosnia and HerzegovinaBotswanaBrazilBrunei DarussalamBulgariaBurkina FasoBurundiCabo VerdeCambodiaCameroonCanadaCaribbean small statesCayman IslandsCentral African RepublicCentral Europe and the BalticsChadChileChinaColombiaComorosCongo, Dem. Rep.Congo, Rep.Costa RicaCote d'IvoireCroatiaCubaCyprusCzech RepublicDenmarkDjiboutiDominicaDominican RepublicEarly-demographic dividendEast Asia & PacificEast Asia & Pacific (excluding high income)East Asia & Pacific (IDA & IBRD countries)EcuadorEgypt, Arab Rep.El SalvadorEquatorial GuineaEritreaEstoniaEthiopiaEuro areaEurope & Central AsiaEurope & Central Asia (excluding high income)Europe & Central Asia (IDA & IBRD countries)European UnionFaroe IslandsFijiFinlandFragile and conflict affected situationsFranceFrench PolynesiaGabonGambia, TheGeorgiaGermanyGhanaGreeceGreenlandGrenadaGuatemalaGuineaGuinea-BissauGuyanaHaitiHeavily indebted poor countries (HIPC)High incomeHondurasHong Kong SAR, ChinaHungaryIBRD onlyIcelandIDA & IBRD totalIDA blendIDA onlyIDA totalIndiaIndonesiaIran, Islamic Rep.IraqIrelandIsraelItalyJamaicaJapanJordanKazakhstanKenyaKiribatiKorea, Rep.KuwaitKyrgyz RepublicLao PDRLate-demographic dividendLatin America & Caribbean Latin America & Caribbean (excluding high income)Latin America & the Caribbean (IDA & IBRD countries)LatviaLeast developed countries: UN classificationLebanonLesothoLiberiaLibyaLithuaniaLow & middle incomeLow incomeLower middle incomeLuxembourgMacao SAR, ChinaMacedonia, FYRMadagascarMalawiMalaysiaMaldivesMaliMaltaMauritaniaMauritiusMexicoMiddle East & North AfricaMiddle East & North Africa (excluding high income)Middle East & North Africa (IDA & IBRD countries)Middle incomeMoldovaMongoliaMoroccoMozambiqueMyanmarNamibiaNepalNetherlandsNew CaledoniaNew ZealandNicaraguaNigerNigeriaNorth AmericaNorwayOECD membersOmanOther small statesPacific island small statesPakistanPalauPanamaPapua New GuineaParaguayPeruPhilippinesPolandPortugalPost-demographic dividendPre-demographic dividendQatarRomaniaRussian FederationRwandaSamoaSao Tome and PrincipeSaudi ArabiaSenegalSerbiaSeychellesSierra LeoneSingaporeSlovak RepublicSloveniaSmall statesSolomon IslandsSomaliaSouth AfricaSouth AsiaSouth Asia (IDA & IBRD)SpainSri LankaSt. Kitts and NevisSt. LuciaSt. Vincent and the GrenadinesSub-Saharan Africa Sub-Saharan Africa (excluding high income)Sub-Saharan Africa (IDA & IBRD countries)SudanSurinameSwazilandSwedenSwitzerlandSyrian Arab RepublicTajikistanTanzaniaThailandTimor-LesteTogoTongaTrinidad and TobagoTunisiaTurkeyTurkmenistanTurks and Caicos IslandsTuvaluUgandaUkraineUnited Arab EmiratesUnited KingdomUnited StatesUpper middle incomeUruguayVanuatuVenezuela, RBVietnamVirgin Islands (U.S.)WorldYemen, Rep.ZambiaZimbabwe Timeline:
This timeline shows a graph from 1963 to 2016 of Sri Lanka. No data until 1962. Number of actual observations by date: 49.
Source name:
World Development Indicators
Source organization:
World Bank staff estimates from the Comtrade database maintained by the United Nations Statistics Division.
Categories, topics:
Energy & Mining, Private Sector, Trade
Last updated:
apr 23, 2017
Indicators value changes by year
Maximum:
31.356
jan 1, 1983
At the date of observation
Value
Absolute change
Change from previous value
jan 1, 1963
8.175
+8.175
0.0%
jan 1, 1964
8.626
+0.452
5.53%
jan 1, 1965
5.384
-3.242
-37.58%
jan 1, 1966
8.129
+2.745
50.98%
jan 1, 1967
6.692
-1.437
-17.67%
jan 1, 1968
7.058
+0.366
5.46%
jan 1, 1969
9.228
+2.171
30.75%
jan 1, 1970
6.355
-2.873
-31.14%
jan 1, 1971
2.676
-3.679
-57.89%
jan 1, 1972
1.545
-1.131
-42.26%
jan 1, 1973
1.892
+0.347
22.46%
jan 1, 1975
19.958
+18.065
954.61%
jan 1, 1976
16.691
-3.267
-16.37%
jan 1, 1977
24.878
+8.187
49.05%
jan 1, 1978
24.116
-0.762
-3.06%
jan 1, 1979
16.538
-7.578
-31.42%
jan 1, 1980
17.55
+1.012
6.12%
jan 1, 1981
24.29
+6.74
38.41%
jan 1, 1982
24.982
+0.692
2.85%
jan 1, 1983
31.356
+6.373
25.51%
jan 1, 1984
23.865
-7.49
-23.89%
jan 1, 1985
25.713
+1.847
7.74%
jan 1, 1986
21.771
-3.941
-15.33%
jan 1, 1987
12.583
-9.188
-42.2%
jan 1, 1988
15.262
+2.679
21.29%
jan 1, 1989
10.764
-4.498
-29.47%
jan 1, 1990
10.732
-0.032
-0.3%
jan 1, 1991
12.641
+1.91
17.79%
jan 1, 1992
10.995
-1.646
-13.02%
jan 1, 1993
8.9
-2.096
-19.06%
jan 1, 1994
7.743
-1.157
-13.0%
jan 1, 1995
6.258
-1.485
-19.18%
jan 1, 2000
5.752
-0.506
-8.08%
jan 1, 2001
9.376
+3.624
63.01%
jan 1, 2002
9.461
+0.085
0.91%
jan 1, 2003
14.008
+4.547
48.06%
jan 1, 2004
11.454
-2.554
-18.23%
jan 1, 2005
14.702
+3.249
28.36%
jan 1, 2006
13.487
-1.216
-8.27%
jan 1, 2007
16.753
+3.266
24.22%
jan 1, 2008
23.609
+6.856
40.93%
jan 1, 2009
23.203
-0.406
-1.72%
jan 1, 2010
19.393
-3.81
-16.42%
jan 1, 2011
16.813
-2.58
-13.3%
jan 1, 2012
20.856
+4.043
24.04%
jan 1, 2013
21.606
+0.75
3.59%
jan 1, 2014
23.733
+2.127
9.84%
jan 1, 2015
22.854
-0.879
-3.7%
jan 1, 2016
14.022
-8.832
-38.64%
Ranking of countries by current statistics by years


Comments: