29
/
en
AIzaSyAYiBZKx7MnpbEhh9jyipgxe19OcubqV5w
April 1, 2024
201561
Morocco
MAR
true
2
1
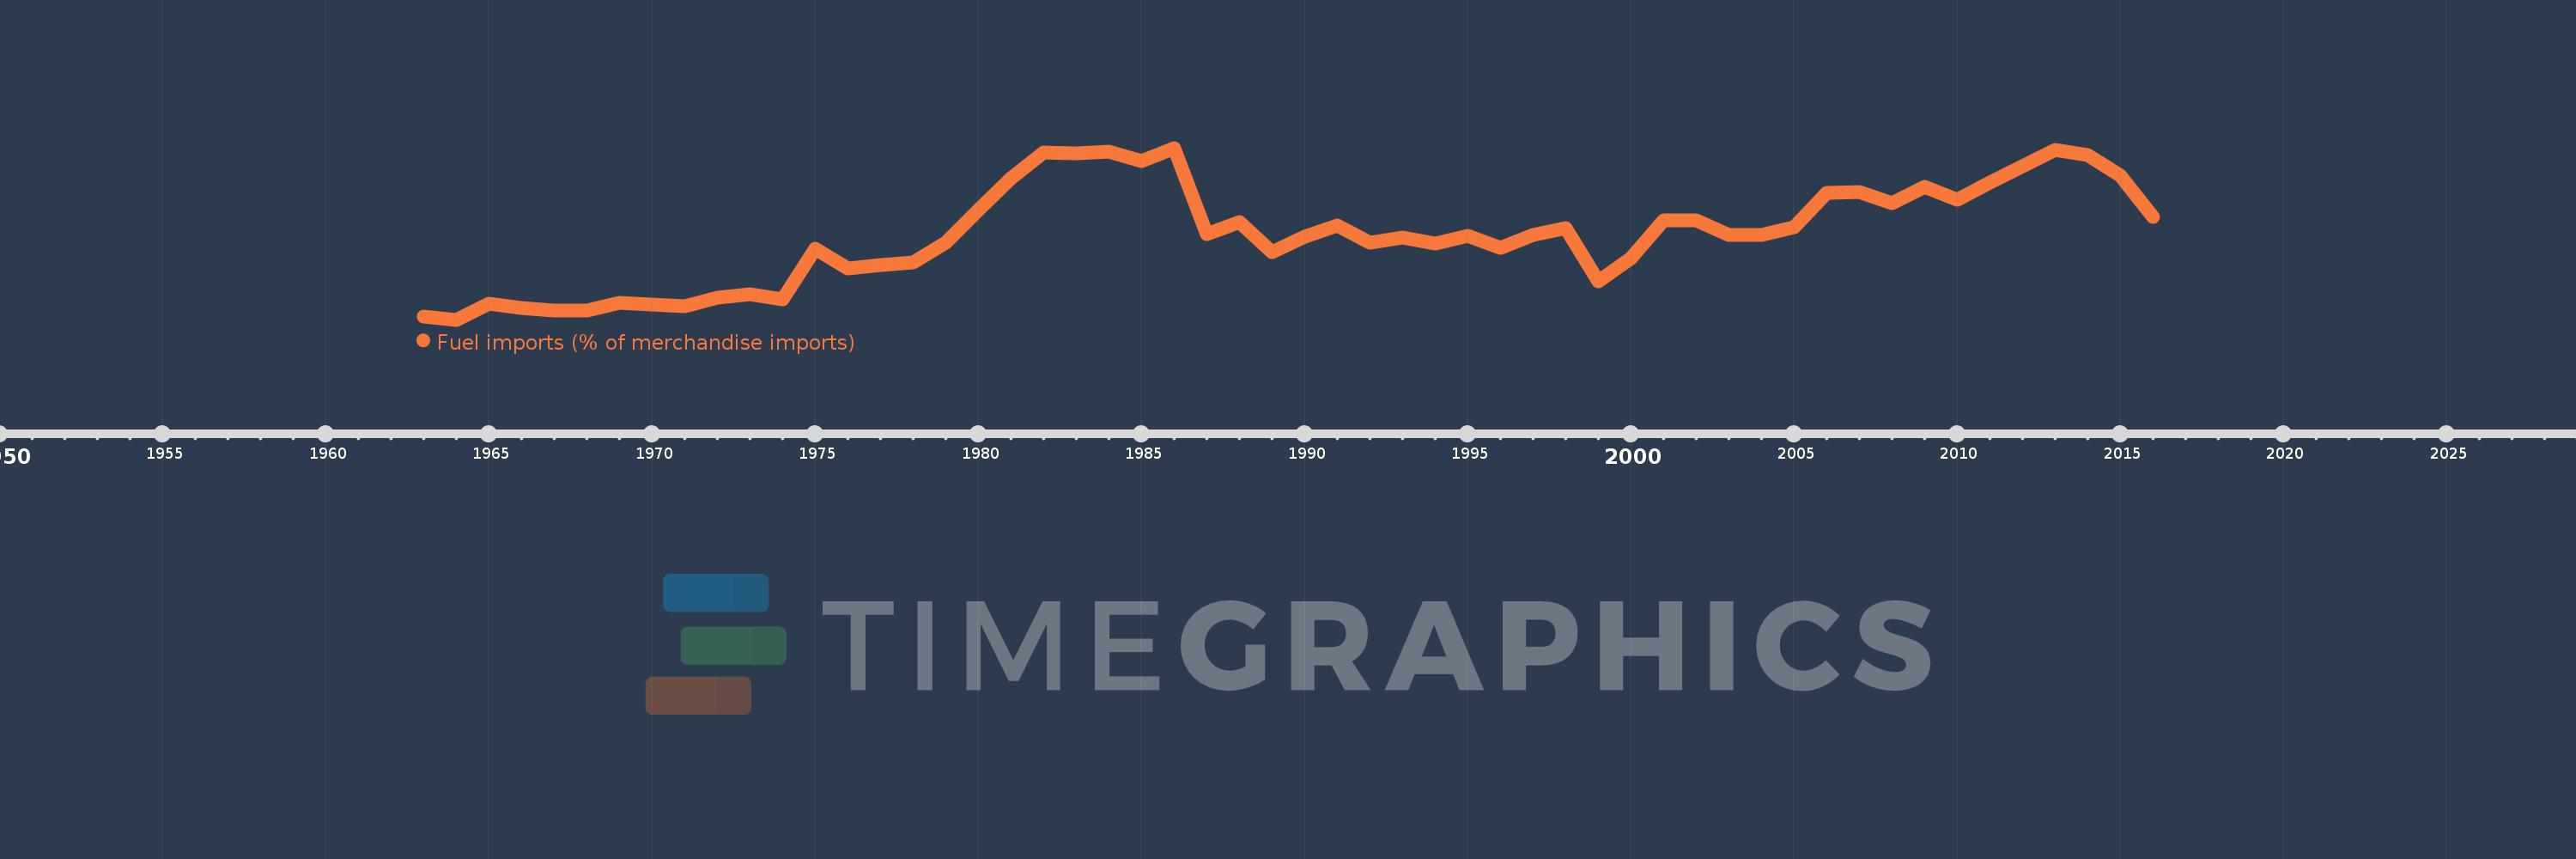
Fuel imports (% of merchandise imports)
2016,2015,2014,2013,2012,2011,2010,2009,2008,2007,2006,2005,2004,2003,2002,2001,2000,1999,1998,1997,1996,1995,1994,1993,1992,1991,1990,1989,1988,1987,1986,1985,1984,1983,1982,1981,1980,1979,1978,1977,1976,1975,1974,1973,1972,1971,1970,1969,1968,1967,1966,1965,1964,1963
This statistics in other country:
AfghanistanAlbaniaAlgeriaAndorraAngolaAntigua and BarbudaArab WorldArgentinaArmeniaArubaAustraliaAustriaAzerbaijanBahamas, TheBahrainBangladeshBarbadosBelarusBelgiumBelizeBeninBermudaBhutanBoliviaBosnia and HerzegovinaBotswanaBrazilBrunei DarussalamBulgariaBurkina FasoBurundiCabo VerdeCambodiaCameroonCanadaCaribbean small statesCayman IslandsCentral African RepublicCentral Europe and the BalticsChadChileChinaColombiaComorosCongo, Dem. Rep.Congo, Rep.Costa RicaCote d'IvoireCroatiaCubaCyprusCzech RepublicDenmarkDjiboutiDominicaDominican RepublicEarly-demographic dividendEast Asia & PacificEast Asia & Pacific (excluding high income)East Asia & Pacific (IDA & IBRD countries)EcuadorEgypt, Arab Rep.El SalvadorEquatorial GuineaEritreaEstoniaEthiopiaEuro areaEurope & Central AsiaEurope & Central Asia (excluding high income)Europe & Central Asia (IDA & IBRD countries)European UnionFaroe IslandsFijiFinlandFragile and conflict affected situationsFranceFrench PolynesiaGabonGambia, TheGeorgiaGermanyGhanaGreeceGreenlandGrenadaGuatemalaGuineaGuinea-BissauGuyanaHaitiHeavily indebted poor countries (HIPC)High incomeHondurasHong Kong SAR, ChinaHungaryIBRD onlyIcelandIDA & IBRD totalIDA blendIDA onlyIDA totalIndiaIndonesiaIran, Islamic Rep.IraqIrelandIsraelItalyJamaicaJapanJordanKazakhstanKenyaKiribatiKorea, Rep.KuwaitKyrgyz RepublicLao PDRLate-demographic dividendLatin America & Caribbean Latin America & Caribbean (excluding high income)Latin America & the Caribbean (IDA & IBRD countries)LatviaLeast developed countries: UN classificationLebanonLesothoLiberiaLibyaLithuaniaLow & middle incomeLow incomeLower middle incomeLuxembourgMacao SAR, ChinaMacedonia, FYRMadagascarMalawiMalaysiaMaldivesMaliMaltaMauritaniaMauritiusMexicoMiddle East & North AfricaMiddle East & North Africa (excluding high income)Middle East & North Africa (IDA & IBRD countries)Middle incomeMoldovaMongoliaMoroccoMozambiqueMyanmarNamibiaNepalNetherlandsNew CaledoniaNew ZealandNicaraguaNigerNigeriaNorth AmericaNorwayOECD membersOmanOther small statesPacific island small statesPakistanPalauPanamaPapua New GuineaParaguayPeruPhilippinesPolandPortugalPost-demographic dividendPre-demographic dividendQatarRomaniaRussian FederationRwandaSamoaSao Tome and PrincipeSaudi ArabiaSenegalSerbiaSeychellesSierra LeoneSingaporeSlovak RepublicSloveniaSmall statesSolomon IslandsSomaliaSouth AfricaSouth AsiaSouth Asia (IDA & IBRD)SpainSri LankaSt. Kitts and NevisSt. LuciaSt. Vincent and the GrenadinesSub-Saharan Africa Sub-Saharan Africa (excluding high income)Sub-Saharan Africa (IDA & IBRD countries)SudanSurinameSwazilandSwedenSwitzerlandSyrian Arab RepublicTajikistanTanzaniaThailandTimor-LesteTogoTongaTrinidad and TobagoTunisiaTurkeyTurkmenistanTurks and Caicos IslandsTuvaluUgandaUkraineUnited Arab EmiratesUnited KingdomUnited StatesUpper middle incomeUruguayVanuatuVenezuela, RBVietnamVirgin Islands (U.S.)WorldYemen, Rep.ZambiaZimbabwe Timeline:
This timeline shows a graph from 1963 to 2016 of Morocco. No data until 1962. Number of actual observations by date: 54.
Source name:
World Development Indicators
Source organization:
World Bank staff estimates from the Comtrade database maintained by the United Nations Statistics Division.
Categories, topics:
Energy & Mining, Private Sector, Trade
Last updated:
apr 23, 2017
Indicators value changes by year
Maximum:
27.948
jan 1, 1986
At the date of observation
Value
Absolute change
Change from previous value
jan 1, 1963
4.028
+4.028
0.0%
jan 1, 1964
3.594
-0.433
-10.76%
jan 1, 1965
5.911
+2.317
64.46%
jan 1, 1966
5.239
-0.673
-11.38%
jan 1, 1967
4.856
-0.383
-7.31%
jan 1, 1968
4.851
-0.005
-0.09%
jan 1, 1969
5.95
+1.099
22.66%
jan 1, 1970
5.803
-0.147
-2.47%
jan 1, 1971
5.464
-0.339
-5.84%
jan 1, 1972
6.68
+1.216
22.26%
jan 1, 1973
7.157
+0.477
7.14%
jan 1, 1974
6.484
-0.673
-9.4%
jan 1, 1975
13.61
+7.126
109.89%
jan 1, 1976
10.851
-2.759
-20.27%
jan 1, 1977
11.383
+0.533
4.91%
jan 1, 1978
11.681
+0.298
2.62%
jan 1, 1979
14.507
+2.826
24.19%
jan 1, 1980
19.167
+4.66
32.12%
jan 1, 1981
23.596
+4.429
23.11%
jan 1, 1982
27.29
+3.694
15.66%
jan 1, 1983
27.187
-0.103
-0.38%
jan 1, 1984
27.48
+0.293
1.08%
jan 1, 1985
26.139
-1.341
-4.88%
jan 1, 1986
27.948
+1.809
6.92%
jan 1, 1987
15.705
-12.243
-43.81%
jan 1, 1988
17.489
+1.784
11.36%
jan 1, 1989
13.171
-4.318
-24.69%
jan 1, 1990
15.36
+2.189
16.62%
jan 1, 1991
16.926
+1.566
10.2%
jan 1, 1992
14.458
-2.467
-14.58%
jan 1, 1993
15.28
+0.822
5.69%
jan 1, 1994
14.369
-0.911
-5.96%
jan 1, 1995
15.522
+1.152
8.02%
jan 1, 1996
13.798
-1.723
-11.1%
jan 1, 1997
15.622
+1.824
13.22%
jan 1, 1998
16.527
+0.905
5.79%
jan 1, 1999
9.033
-7.494
-45.34%
jan 1, 2000
12.322
+3.288
36.4%
jan 1, 2001
17.723
+5.401
43.84%
jan 1, 2002
17.688
-0.035
-0.2%
jan 1, 2003
15.557
-2.131
-12.05%
jan 1, 2004
15.658
+0.101
0.65%
jan 1, 2005
16.698
+1.04
6.64%
jan 1, 2006
21.53
+4.832
28.94%
jan 1, 2007
21.717
+0.187
0.87%
jan 1, 2008
20.08
-1.637
-7.54%
jan 1, 2009
22.375
+2.295
11.43%
jan 1, 2010
20.605
-1.77
-7.91%
jan 1, 2011
23.069
+2.464
11.96%
jan 1, 2012
25.33
+2.261
9.8%
jan 1, 2013
27.658
+2.328
9.19%
jan 1, 2014
26.956
-0.702
-2.54%
jan 1, 2015
24.064
-2.892
-10.73%
jan 1, 2016
18.192
-5.872
-24.4%
Ranking of countries by current statistics by years


Comments: