29
/
en
AIzaSyAYiBZKx7MnpbEhh9jyipgxe19OcubqV5w
April 1, 2024
269319
Turkey
TUR
true
2
1
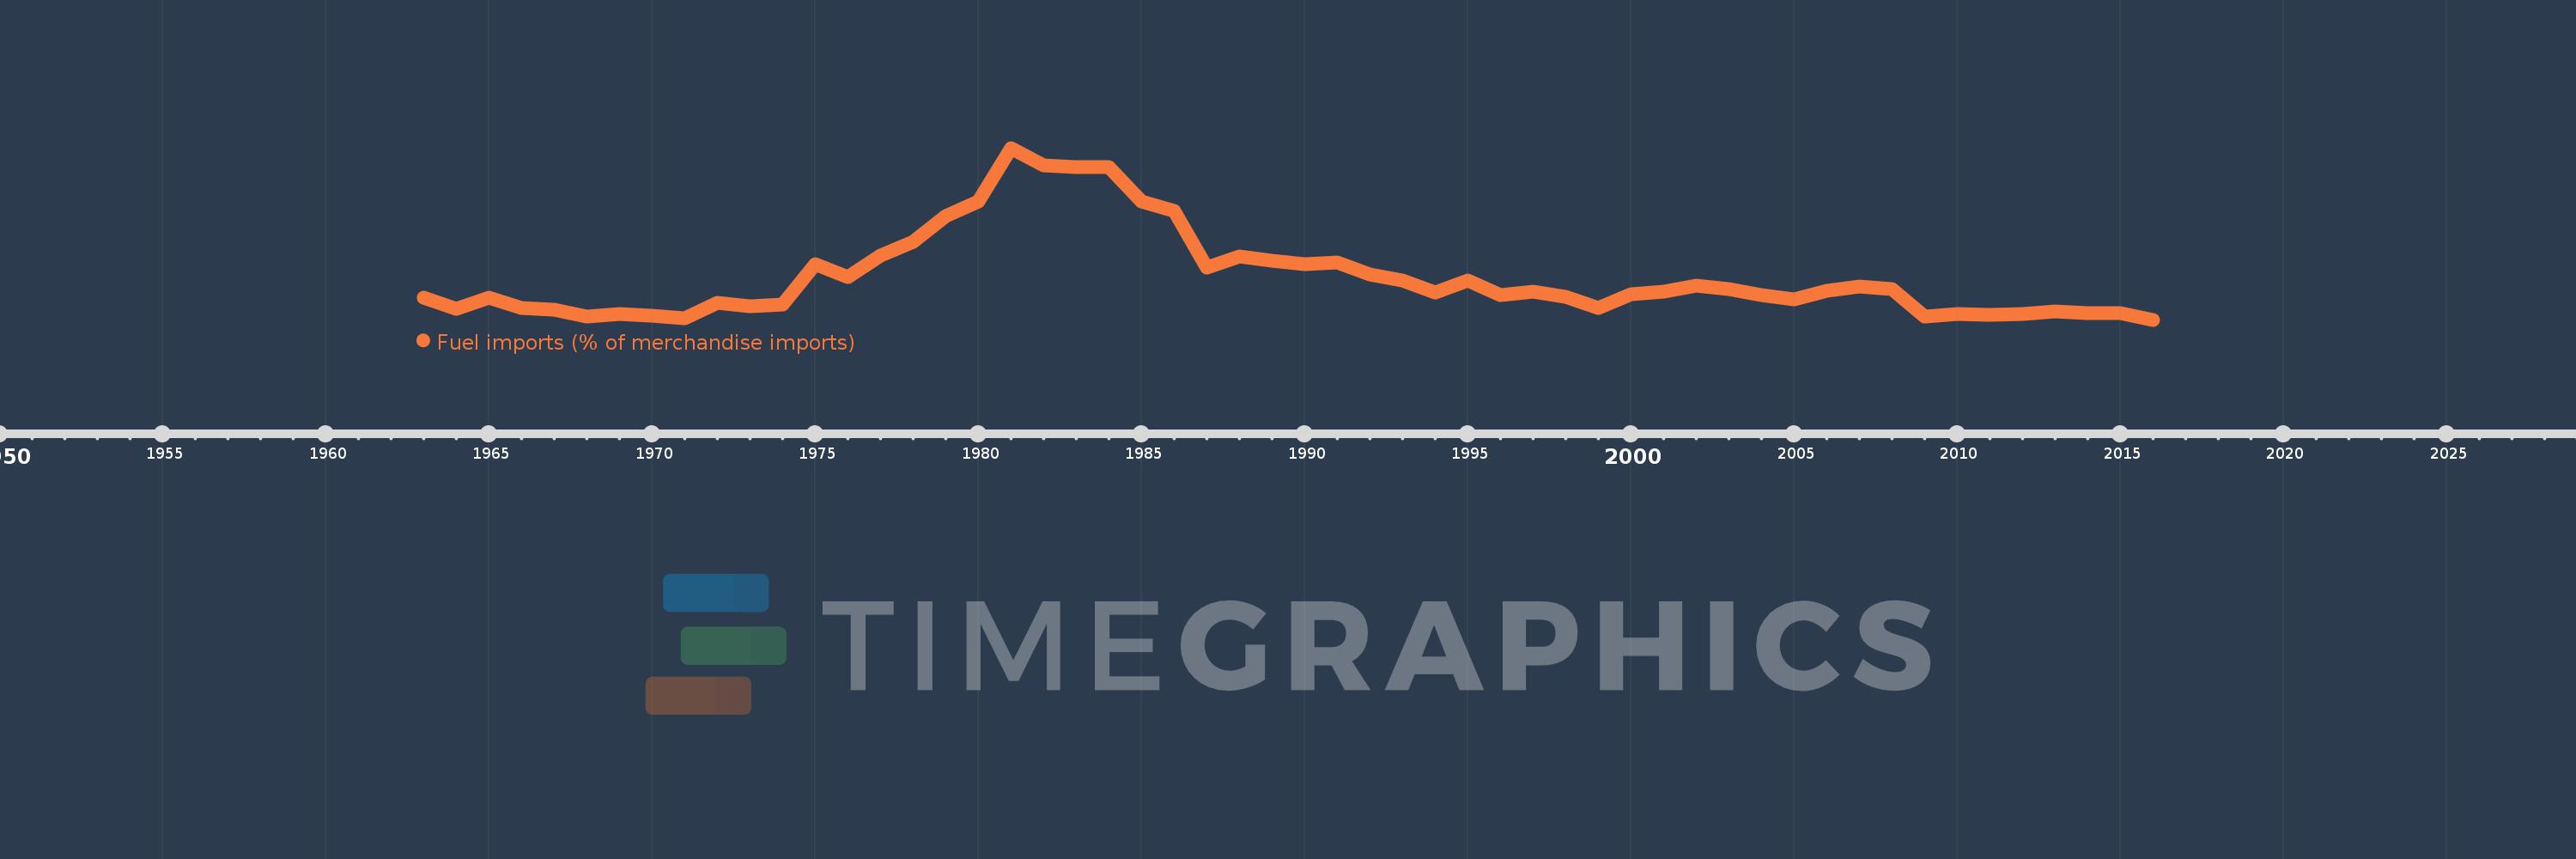
Fuel imports (% of merchandise imports)
2016,2015,2014,2013,2012,2011,2010,2009,2008,2007,2006,2005,2004,2003,2002,2001,2000,1999,1998,1997,1996,1995,1994,1993,1992,1991,1990,1989,1988,1987,1986,1985,1984,1983,1982,1981,1980,1979,1978,1977,1976,1975,1974,1973,1972,1971,1970,1969,1968,1967,1966,1965,1964,1963
This statistics in other country:
AfghanistanAlbaniaAlgeriaAndorraAngolaAntigua and BarbudaArab WorldArgentinaArmeniaArubaAustraliaAustriaAzerbaijanBahamas, TheBahrainBangladeshBarbadosBelarusBelgiumBelizeBeninBermudaBhutanBoliviaBosnia and HerzegovinaBotswanaBrazilBrunei DarussalamBulgariaBurkina FasoBurundiCabo VerdeCambodiaCameroonCanadaCaribbean small statesCayman IslandsCentral African RepublicCentral Europe and the BalticsChadChileChinaColombiaComorosCongo, Dem. Rep.Congo, Rep.Costa RicaCote d'IvoireCroatiaCubaCyprusCzech RepublicDenmarkDjiboutiDominicaDominican RepublicEarly-demographic dividendEast Asia & PacificEast Asia & Pacific (excluding high income)East Asia & Pacific (IDA & IBRD countries)EcuadorEgypt, Arab Rep.El SalvadorEquatorial GuineaEritreaEstoniaEthiopiaEuro areaEurope & Central AsiaEurope & Central Asia (excluding high income)Europe & Central Asia (IDA & IBRD countries)European UnionFaroe IslandsFijiFinlandFragile and conflict affected situationsFranceFrench PolynesiaGabonGambia, TheGeorgiaGermanyGhanaGreeceGreenlandGrenadaGuatemalaGuineaGuinea-BissauGuyanaHaitiHeavily indebted poor countries (HIPC)High incomeHondurasHong Kong SAR, ChinaHungaryIBRD onlyIcelandIDA & IBRD totalIDA blendIDA onlyIDA totalIndiaIndonesiaIran, Islamic Rep.IraqIrelandIsraelItalyJamaicaJapanJordanKazakhstanKenyaKiribatiKorea, Rep.KuwaitKyrgyz RepublicLao PDRLate-demographic dividendLatin America & Caribbean Latin America & Caribbean (excluding high income)Latin America & the Caribbean (IDA & IBRD countries)LatviaLeast developed countries: UN classificationLebanonLesothoLiberiaLibyaLithuaniaLow & middle incomeLow incomeLower middle incomeLuxembourgMacao SAR, ChinaMacedonia, FYRMadagascarMalawiMalaysiaMaldivesMaliMaltaMauritaniaMauritiusMexicoMiddle East & North AfricaMiddle East & North Africa (excluding high income)Middle East & North Africa (IDA & IBRD countries)Middle incomeMoldovaMongoliaMoroccoMozambiqueMyanmarNamibiaNepalNetherlandsNew CaledoniaNew ZealandNicaraguaNigerNigeriaNorth AmericaNorwayOECD membersOmanOther small statesPacific island small statesPakistanPalauPanamaPapua New GuineaParaguayPeruPhilippinesPolandPortugalPost-demographic dividendPre-demographic dividendQatarRomaniaRussian FederationRwandaSamoaSao Tome and PrincipeSaudi ArabiaSenegalSerbiaSeychellesSierra LeoneSingaporeSlovak RepublicSloveniaSmall statesSolomon IslandsSomaliaSouth AfricaSouth AsiaSouth Asia (IDA & IBRD)SpainSri LankaSt. Kitts and NevisSt. LuciaSt. Vincent and the GrenadinesSub-Saharan Africa Sub-Saharan Africa (excluding high income)Sub-Saharan Africa (IDA & IBRD countries)SudanSurinameSwazilandSwedenSwitzerlandSyrian Arab RepublicTajikistanTanzaniaThailandTimor-LesteTogoTongaTrinidad and TobagoTunisiaTurkeyTurkmenistanTurks and Caicos IslandsTuvaluUgandaUkraineUnited Arab EmiratesUnited KingdomUnited StatesUpper middle incomeUruguayVanuatuVenezuela, RBVietnamVirgin Islands (U.S.)WorldYemen, Rep.ZambiaZimbabwe Timeline:
This timeline shows a graph from 1963 to 2016 of Turkey. No data until 1962. Number of actual observations by date: 54.
Source name:
World Development Indicators
Source organization:
World Bank staff estimates from the Comtrade database maintained by the United Nations Statistics Division.
Categories, topics:
Energy & Mining, Private Sector, Trade
Last updated:
apr 23, 2017
Indicators value changes by year
Maximum:
48.447
jan 1, 1981
At the date of observation
Value
Absolute change
Change from previous value
jan 1, 1963
12.388
+12.388
0.0%
jan 1, 1964
9.627
-2.761
-22.29%
jan 1, 1965
12.487
+2.861
29.72%
jan 1, 1966
9.982
-2.505
-20.06%
jan 1, 1967
9.555
-0.427
-4.27%
jan 1, 1968
7.844
-1.711
-17.91%
jan 1, 1969
8.416
+0.572
7.29%
jan 1, 1970
8.103
-0.313
-3.72%
jan 1, 1971
7.515
-0.589
-7.26%
jan 1, 1972
11.198
+3.684
49.02%
jan 1, 1973
10.326
-0.872
-7.79%
jan 1, 1974
10.848
+0.522
5.06%
jan 1, 1975
20.53
+9.682
89.25%
jan 1, 1976
17.45
-3.08
-15.0%
jan 1, 1977
22.572
+5.121
29.35%
jan 1, 1978
25.833
+3.261
14.45%
jan 1, 1979
32.155
+6.322
24.47%
jan 1, 1980
35.581
+3.426
10.66%
jan 1, 1981
48.447
+12.866
36.16%
jan 1, 1982
44.215
-4.232
-8.74%
jan 1, 1983
43.785
-0.43
-0.97%
jan 1, 1984
43.823
+0.038
0.09%
jan 1, 1985
35.583
-8.24
-18.8%
jan 1, 1986
33.378
-2.205
-6.2%
jan 1, 1987
19.732
-13.645
-40.88%
jan 1, 1988
22.363
+2.631
13.33%
jan 1, 1989
21.326
-1.037
-4.64%
jan 1, 1990
20.491
-0.835
-3.92%
jan 1, 1991
20.807
+0.316
1.54%
jan 1, 1992
17.918
-2.889
-13.88%
jan 1, 1993
16.527
-1.39
-7.76%
jan 1, 1994
13.552
-2.976
-18.0%
jan 1, 1995
16.489
+2.937
21.67%
jan 1, 1996
13.037
-3.451
-20.93%
jan 1, 1997
13.897
+0.86
6.59%
jan 1, 1998
12.578
-1.318
-9.49%
jan 1, 1999
9.904
-2.675
-21.26%
jan 1, 2000
13.299
+3.395
34.28%
jan 1, 2001
13.948
+0.649
4.88%
jan 1, 2002
15.279
+1.33
9.54%
jan 1, 2003
14.467
-0.812
-5.31%
jan 1, 2004
12.95
-1.517
-10.48%
jan 1, 2005
11.913
-1.038
-8.01%
jan 1, 2006
14.031
+2.118
17.78%
jan 1, 2007
15.077
+1.047
7.46%
jan 1, 2008
14.584
-0.493
-3.27%
jan 1, 2009
7.764
-6.82
-46.77%
jan 1, 2010
8.416
+0.652
8.4%
jan 1, 2011
8.26
-0.156
-1.85%
jan 1, 2012
8.462
+0.202
2.45%
jan 1, 2013
9.072
+0.61
7.21%
jan 1, 2014
8.608
-0.465
-5.12%
jan 1, 2015
8.598
-0.009
-0.11%
jan 1, 2016
7.102
-1.496
-17.4%
Ranking of countries by current statistics by years


Comments: