29
/
en
AIzaSyAYiBZKx7MnpbEhh9jyipgxe19OcubqV5w
April 1, 2024
52603
OECD members
OED
false
2
1
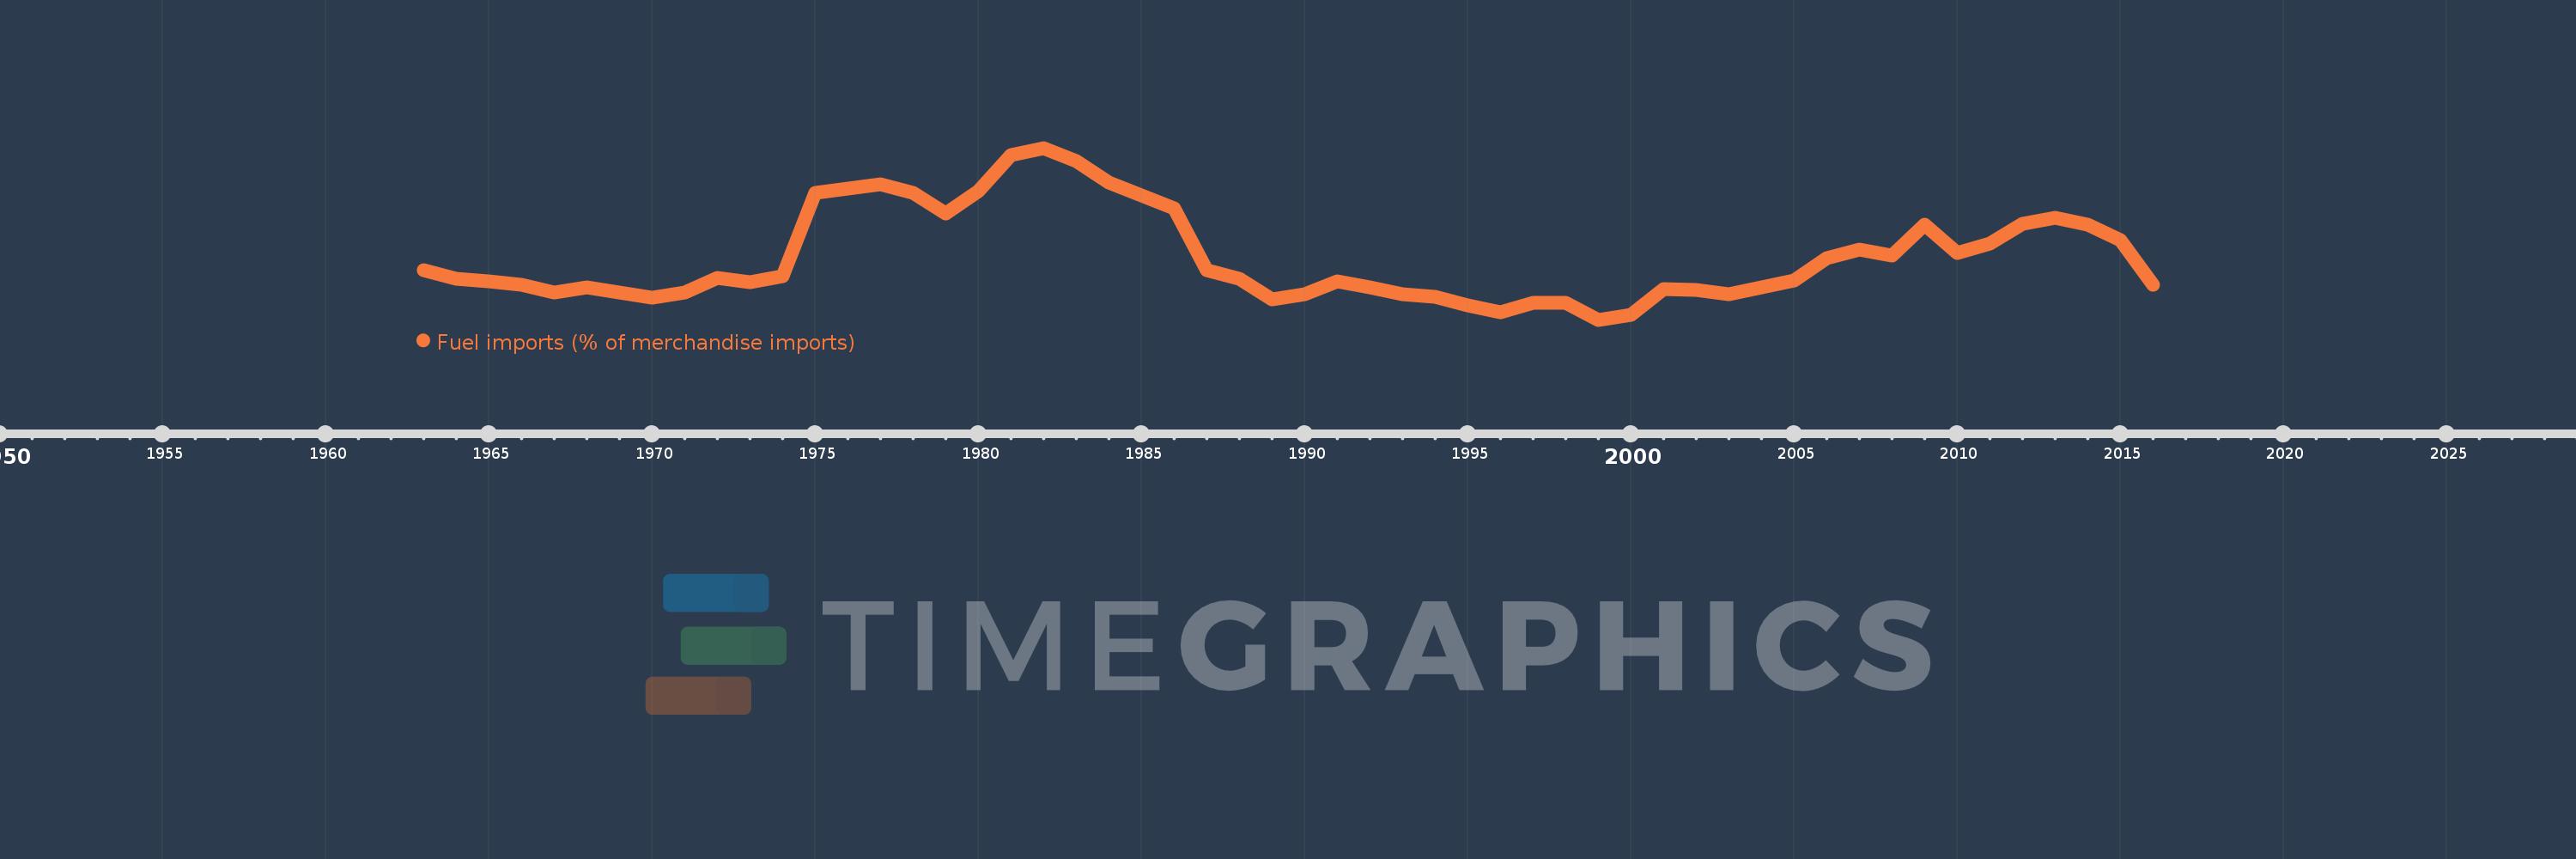
Fuel imports (% of merchandise imports)
2016,2015,2014,2013,2012,2011,2010,2009,2008,2007,2006,2005,2004,2003,2002,2001,2000,1999,1998,1997,1996,1995,1994,1993,1992,1991,1990,1989,1988,1987,1986,1985,1984,1983,1982,1981,1980,1979,1978,1977,1976,1975,1974,1973,1972,1971,1970,1969,1968,1967,1966,1965,1964,1963
This statistics in other country:
AfghanistanAlbaniaAlgeriaAndorraAngolaAntigua and BarbudaArab WorldArgentinaArmeniaArubaAustraliaAustriaAzerbaijanBahamas, TheBahrainBangladeshBarbadosBelarusBelgiumBelizeBeninBermudaBhutanBoliviaBosnia and HerzegovinaBotswanaBrazilBrunei DarussalamBulgariaBurkina FasoBurundiCabo VerdeCambodiaCameroonCanadaCaribbean small statesCayman IslandsCentral African RepublicCentral Europe and the BalticsChadChileChinaColombiaComorosCongo, Dem. Rep.Congo, Rep.Costa RicaCote d'IvoireCroatiaCubaCyprusCzech RepublicDenmarkDjiboutiDominicaDominican RepublicEarly-demographic dividendEast Asia & PacificEast Asia & Pacific (excluding high income)East Asia & Pacific (IDA & IBRD countries)EcuadorEgypt, Arab Rep.El SalvadorEquatorial GuineaEritreaEstoniaEthiopiaEuro areaEurope & Central AsiaEurope & Central Asia (excluding high income)Europe & Central Asia (IDA & IBRD countries)European UnionFaroe IslandsFijiFinlandFragile and conflict affected situationsFranceFrench PolynesiaGabonGambia, TheGeorgiaGermanyGhanaGreeceGreenlandGrenadaGuatemalaGuineaGuinea-BissauGuyanaHaitiHeavily indebted poor countries (HIPC)High incomeHondurasHong Kong SAR, ChinaHungaryIBRD onlyIcelandIDA & IBRD totalIDA blendIDA onlyIDA totalIndiaIndonesiaIran, Islamic Rep.IraqIrelandIsraelItalyJamaicaJapanJordanKazakhstanKenyaKiribatiKorea, Rep.KuwaitKyrgyz RepublicLao PDRLate-demographic dividendLatin America & Caribbean Latin America & Caribbean (excluding high income)Latin America & the Caribbean (IDA & IBRD countries)LatviaLeast developed countries: UN classificationLebanonLesothoLiberiaLibyaLithuaniaLow & middle incomeLow incomeLower middle incomeLuxembourgMacao SAR, ChinaMacedonia, FYRMadagascarMalawiMalaysiaMaldivesMaliMaltaMauritaniaMauritiusMexicoMiddle East & North AfricaMiddle East & North Africa (excluding high income)Middle East & North Africa (IDA & IBRD countries)Middle incomeMoldovaMongoliaMoroccoMozambiqueMyanmarNamibiaNepalNetherlandsNew CaledoniaNew ZealandNicaraguaNigerNigeriaNorth AmericaNorwayOECD membersOmanOther small statesPacific island small statesPakistanPalauPanamaPapua New GuineaParaguayPeruPhilippinesPolandPortugalPost-demographic dividendPre-demographic dividendQatarRomaniaRussian FederationRwandaSamoaSao Tome and PrincipeSaudi ArabiaSenegalSerbiaSeychellesSierra LeoneSingaporeSlovak RepublicSloveniaSmall statesSolomon IslandsSomaliaSouth AfricaSouth AsiaSouth Asia (IDA & IBRD)SpainSri LankaSt. Kitts and NevisSt. LuciaSt. Vincent and the GrenadinesSub-Saharan Africa Sub-Saharan Africa (excluding high income)Sub-Saharan Africa (IDA & IBRD countries)SudanSurinameSwazilandSwedenSwitzerlandSyrian Arab RepublicTajikistanTanzaniaThailandTimor-LesteTogoTongaTrinidad and TobagoTunisiaTurkeyTurkmenistanTurks and Caicos IslandsTuvaluUgandaUkraineUnited Arab EmiratesUnited KingdomUnited StatesUpper middle incomeUruguayVanuatuVenezuela, RBVietnamVirgin Islands (U.S.)WorldYemen, Rep.ZambiaZimbabwe Timeline:
This timeline shows a graph from 1963 to 2016 of OECD members. No data until 1962. Number of actual observations by date: 54.
Source name:
World Development Indicators
Source organization:
World Bank staff estimates from the Comtrade database maintained by the United Nations Statistics Division.
Categories, topics:
Energy & Mining, Private Sector, Trade
Last updated:
apr 23, 2017
Indicators value changes by year
Maximum:
27.064
jan 1, 1982
At the date of observation
Value
Absolute change
Change from previous value
jan 1, 1963
12.647
+12.647
0.0%
jan 1, 1964
11.64
-1.006
-7.96%
jan 1, 1965
11.354
-0.287
-2.46%
jan 1, 1966
11.01
-0.343
-3.02%
jan 1, 1967
10.12
-0.89
-8.08%
jan 1, 1968
10.703
+0.583
5.76%
jan 1, 1969
10.098
-0.606
-5.66%
jan 1, 1970
9.46
-0.638
-6.31%
jan 1, 1971
10.04
+0.58
6.13%
jan 1, 1972
11.766
+1.725
17.18%
jan 1, 1973
11.317
-0.449
-3.82%
jan 1, 1974
11.999
+0.682
6.02%
jan 1, 1975
21.744
+9.745
81.22%
jan 1, 1976
22.313
+0.569
2.62%
jan 1, 1977
22.769
+0.455
2.04%
jan 1, 1978
21.826
-0.943
-4.14%
jan 1, 1979
19.398
-2.427
-11.12%
jan 1, 1980
22.024
+2.625
13.53%
jan 1, 1981
26.238
+4.215
19.14%
jan 1, 1982
27.064
+0.826
3.15%
jan 1, 1983
25.545
-1.518
-5.61%
jan 1, 1984
23.035
-2.51
-9.83%
jan 1, 1985
21.479
-1.556
-6.76%
jan 1, 1986
19.992
-1.487
-6.92%
jan 1, 1987
12.661
-7.331
-36.67%
jan 1, 1988
11.671
-0.99
-7.82%
jan 1, 1989
9.228
-2.443
-20.93%
jan 1, 1990
9.893
+0.665
7.21%
jan 1, 1991
11.352
+1.459
14.74%
jan 1, 1992
10.634
-0.718
-6.32%
jan 1, 1993
9.917
-0.717
-6.74%
jan 1, 1994
9.6
-0.317
-3.19%
jan 1, 1995
8.513
-1.087
-11.32%
jan 1, 1996
7.725
-0.788
-9.25%
jan 1, 1997
8.822
+1.096
14.19%
jan 1, 1998
8.814
-0.008
-0.09%
jan 1, 1999
6.87
-1.944
-22.05%
jan 1, 2000
7.449
+0.579
8.43%
jan 1, 2001
10.471
+3.022
40.58%
jan 1, 2002
10.353
-0.118
-1.12%
jan 1, 2003
9.867
-0.487
-4.7%
jan 1, 2004
10.631
+0.765
7.75%
jan 1, 2005
11.481
+0.85
8.0%
jan 1, 2006
14.131
+2.649
23.08%
jan 1, 2007
15.124
+0.993
7.03%
jan 1, 2008
14.457
-0.667
-4.41%
jan 1, 2009
18.014
+3.558
24.61%
jan 1, 2010
14.76
-3.255
-18.07%
jan 1, 2011
15.83
+1.07
7.25%
jan 1, 2012
18.159
+2.329
14.71%
jan 1, 2013
18.836
+0.677
3.73%
jan 1, 2014
18.076
-0.759
-4.03%
jan 1, 2015
16.221
-1.855
-10.26%
jan 1, 2016
10.976
-5.245
-32.33%
Ranking of countries by current statistics by years


Comments: