29
/
en
AIzaSyAYiBZKx7MnpbEhh9jyipgxe19OcubqV5w
April 1, 2024
224839
Poland
POL
true
2
1
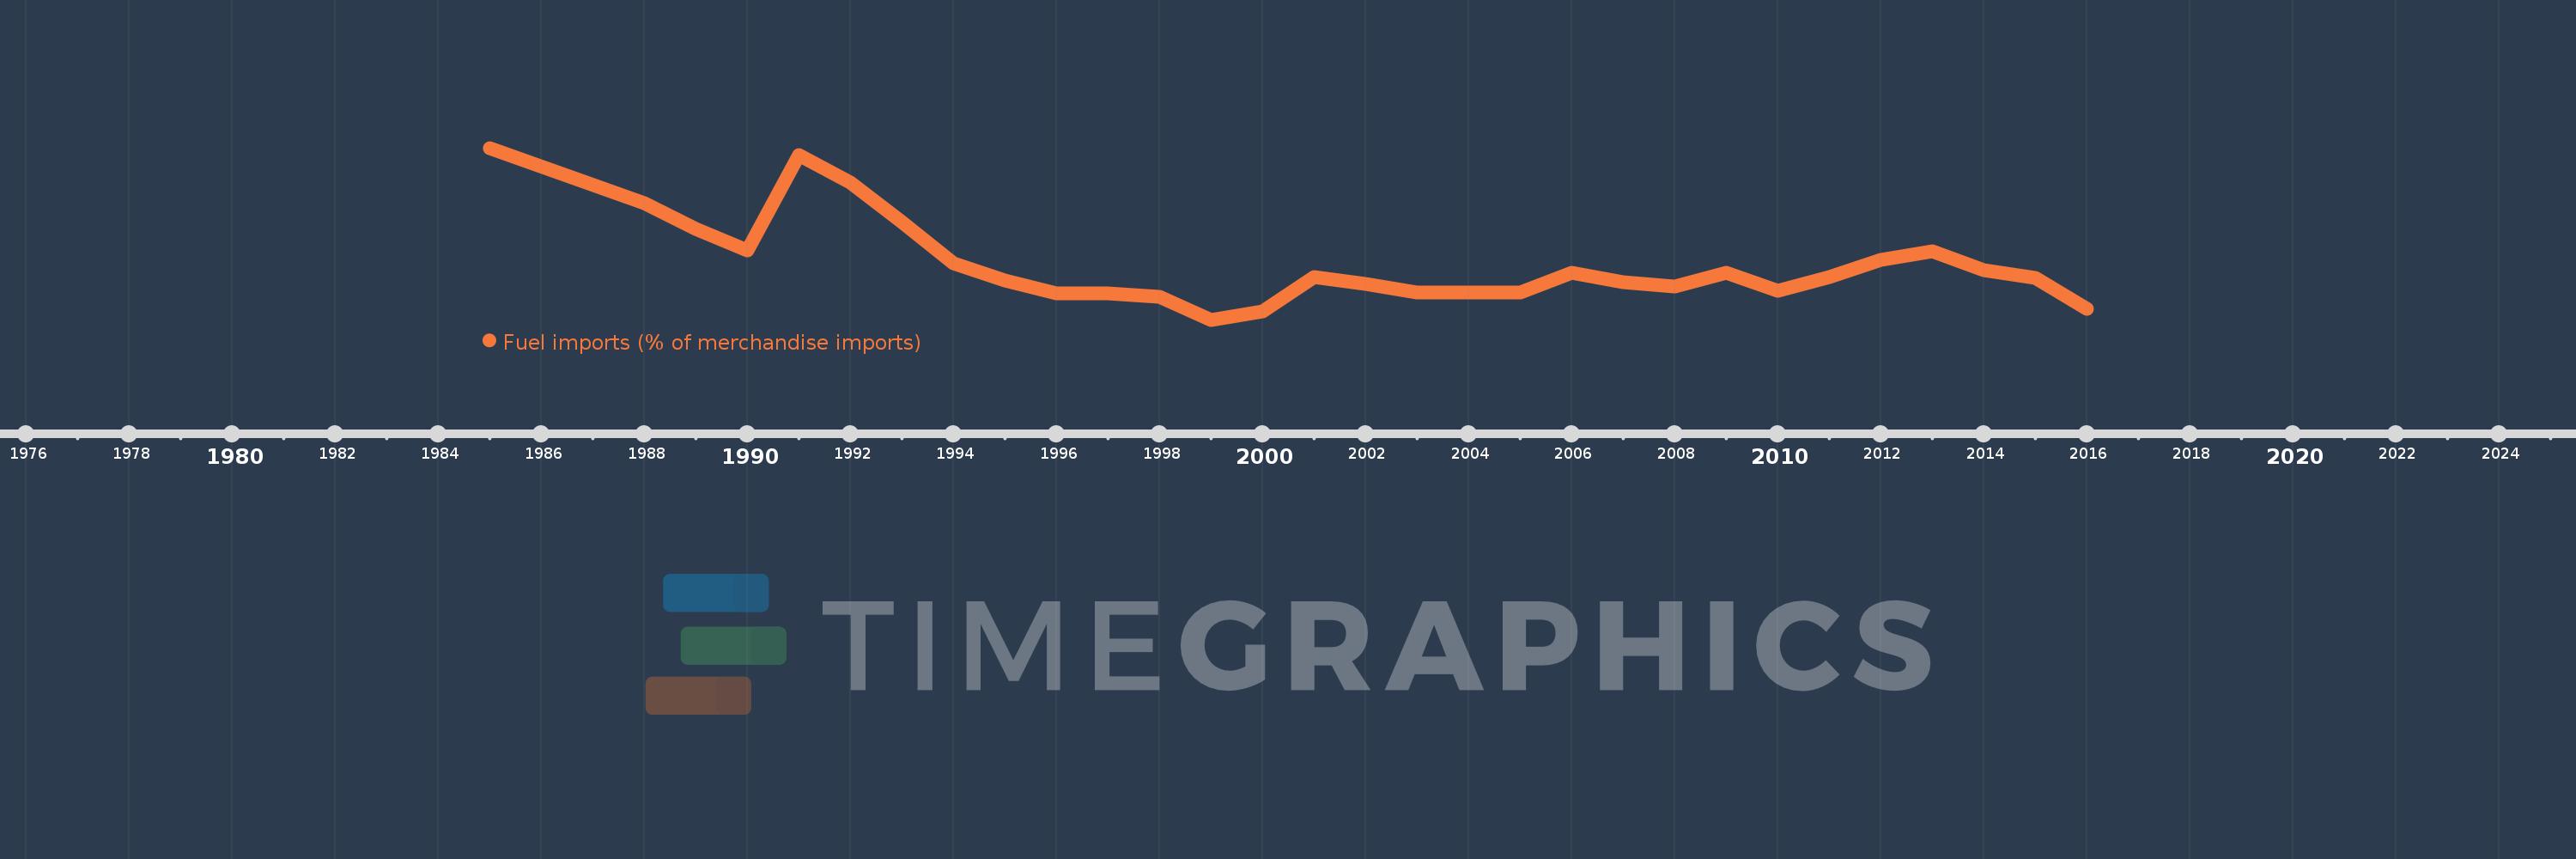
Fuel imports (% of merchandise imports)
2016,2015,2014,2013,2012,2011,2010,2009,2008,2007,2006,2005,2004,2003,2002,2001,2000,1999,1998,1997,1996,1995,1994,1993,1992,1991,1990,1989,1988,1985
This statistics in other country:
AfghanistanAlbaniaAlgeriaAndorraAngolaAntigua and BarbudaArab WorldArgentinaArmeniaArubaAustraliaAustriaAzerbaijanBahamas, TheBahrainBangladeshBarbadosBelarusBelgiumBelizeBeninBermudaBhutanBoliviaBosnia and HerzegovinaBotswanaBrazilBrunei DarussalamBulgariaBurkina FasoBurundiCabo VerdeCambodiaCameroonCanadaCaribbean small statesCayman IslandsCentral African RepublicCentral Europe and the BalticsChadChileChinaColombiaComorosCongo, Dem. Rep.Congo, Rep.Costa RicaCote d'IvoireCroatiaCubaCyprusCzech RepublicDenmarkDjiboutiDominicaDominican RepublicEarly-demographic dividendEast Asia & PacificEast Asia & Pacific (excluding high income)East Asia & Pacific (IDA & IBRD countries)EcuadorEgypt, Arab Rep.El SalvadorEquatorial GuineaEritreaEstoniaEthiopiaEuro areaEurope & Central AsiaEurope & Central Asia (excluding high income)Europe & Central Asia (IDA & IBRD countries)European UnionFaroe IslandsFijiFinlandFragile and conflict affected situationsFranceFrench PolynesiaGabonGambia, TheGeorgiaGermanyGhanaGreeceGreenlandGrenadaGuatemalaGuineaGuinea-BissauGuyanaHaitiHeavily indebted poor countries (HIPC)High incomeHondurasHong Kong SAR, ChinaHungaryIBRD onlyIcelandIDA & IBRD totalIDA blendIDA onlyIDA totalIndiaIndonesiaIran, Islamic Rep.IraqIrelandIsraelItalyJamaicaJapanJordanKazakhstanKenyaKiribatiKorea, Rep.KuwaitKyrgyz RepublicLao PDRLate-demographic dividendLatin America & Caribbean Latin America & Caribbean (excluding high income)Latin America & the Caribbean (IDA & IBRD countries)LatviaLeast developed countries: UN classificationLebanonLesothoLiberiaLibyaLithuaniaLow & middle incomeLow incomeLower middle incomeLuxembourgMacao SAR, ChinaMacedonia, FYRMadagascarMalawiMalaysiaMaldivesMaliMaltaMauritaniaMauritiusMexicoMiddle East & North AfricaMiddle East & North Africa (excluding high income)Middle East & North Africa (IDA & IBRD countries)Middle incomeMoldovaMongoliaMoroccoMozambiqueMyanmarNamibiaNepalNetherlandsNew CaledoniaNew ZealandNicaraguaNigerNigeriaNorth AmericaNorwayOECD membersOmanOther small statesPacific island small statesPakistanPalauPanamaPapua New GuineaParaguayPeruPhilippinesPolandPortugalPost-demographic dividendPre-demographic dividendQatarRomaniaRussian FederationRwandaSamoaSao Tome and PrincipeSaudi ArabiaSenegalSerbiaSeychellesSierra LeoneSingaporeSlovak RepublicSloveniaSmall statesSolomon IslandsSomaliaSouth AfricaSouth AsiaSouth Asia (IDA & IBRD)SpainSri LankaSt. Kitts and NevisSt. LuciaSt. Vincent and the GrenadinesSub-Saharan Africa Sub-Saharan Africa (excluding high income)Sub-Saharan Africa (IDA & IBRD countries)SudanSurinameSwazilandSwedenSwitzerlandSyrian Arab RepublicTajikistanTanzaniaThailandTimor-LesteTogoTongaTrinidad and TobagoTunisiaTurkeyTurkmenistanTurks and Caicos IslandsTuvaluUgandaUkraineUnited Arab EmiratesUnited KingdomUnited StatesUpper middle incomeUruguayVanuatuVenezuela, RBVietnamVirgin Islands (U.S.)WorldYemen, Rep.ZambiaZimbabwe Timeline:
This timeline shows a graph from 1985 to 2016 of Poland. No data until 1984. Number of actual observations by date: 30.
Source name:
World Development Indicators
Source organization:
World Bank staff estimates from the Comtrade database maintained by the United Nations Statistics Division.
Categories, topics:
Energy & Mining, Private Sector, Trade
Last updated:
apr 23, 2017
Indicators value changes by year
Maximum:
24.754
jan 1, 1985
At the date of observation
Value
Absolute change
Change from previous value
jan 1, 1985
24.754
+24.754
0.0%
jan 1, 1988
18.853
-5.901
-23.84%
jan 1, 1989
16.114
-2.739
-14.53%
jan 1, 1990
13.751
-2.362
-14.66%
jan 1, 1991
23.974
+10.223
74.34%
jan 1, 1992
21.029
-2.945
-12.28%
jan 1, 1993
16.802
-4.227
-20.1%
jan 1, 1994
12.432
-4.37
-26.01%
jan 1, 1995
10.55
-1.882
-15.14%
jan 1, 1996
9.174
-1.376
-13.04%
jan 1, 1997
9.2
+0.026
0.28%
jan 1, 1998
8.843
-0.357
-3.88%
jan 1, 1999
6.374
-2.468
-27.92%
jan 1, 2000
7.221
+0.847
13.29%
jan 1, 2001
10.984
+3.763
52.11%
jan 1, 2002
10.251
-0.732
-6.67%
jan 1, 2003
9.288
-0.963
-9.4%
jan 1, 2004
9.245
-0.043
-0.47%
jan 1, 2005
9.259
+0.014
0.15%
jan 1, 2006
11.414
+2.155
23.28%
jan 1, 2007
10.401
-1.013
-8.87%
jan 1, 2008
9.971
-0.43
-4.13%
jan 1, 2009
11.358
+1.387
13.91%
jan 1, 2010
9.458
-1.9
-16.73%
jan 1, 2011
10.93
+1.472
15.57%
jan 1, 2012
12.816
+1.886
17.25%
jan 1, 2013
13.673
+0.857
6.69%
jan 1, 2014
11.652
-2.021
-14.78%
jan 1, 2015
10.817
-0.835
-7.17%
jan 1, 2016
7.562
-3.255
-30.09%
Ranking of countries by current statistics by years


Comments: