29
/
en
AIzaSyAYiBZKx7MnpbEhh9jyipgxe19OcubqV5w
April 1, 2024
78234
Bangladesh
BGD
true
2
1
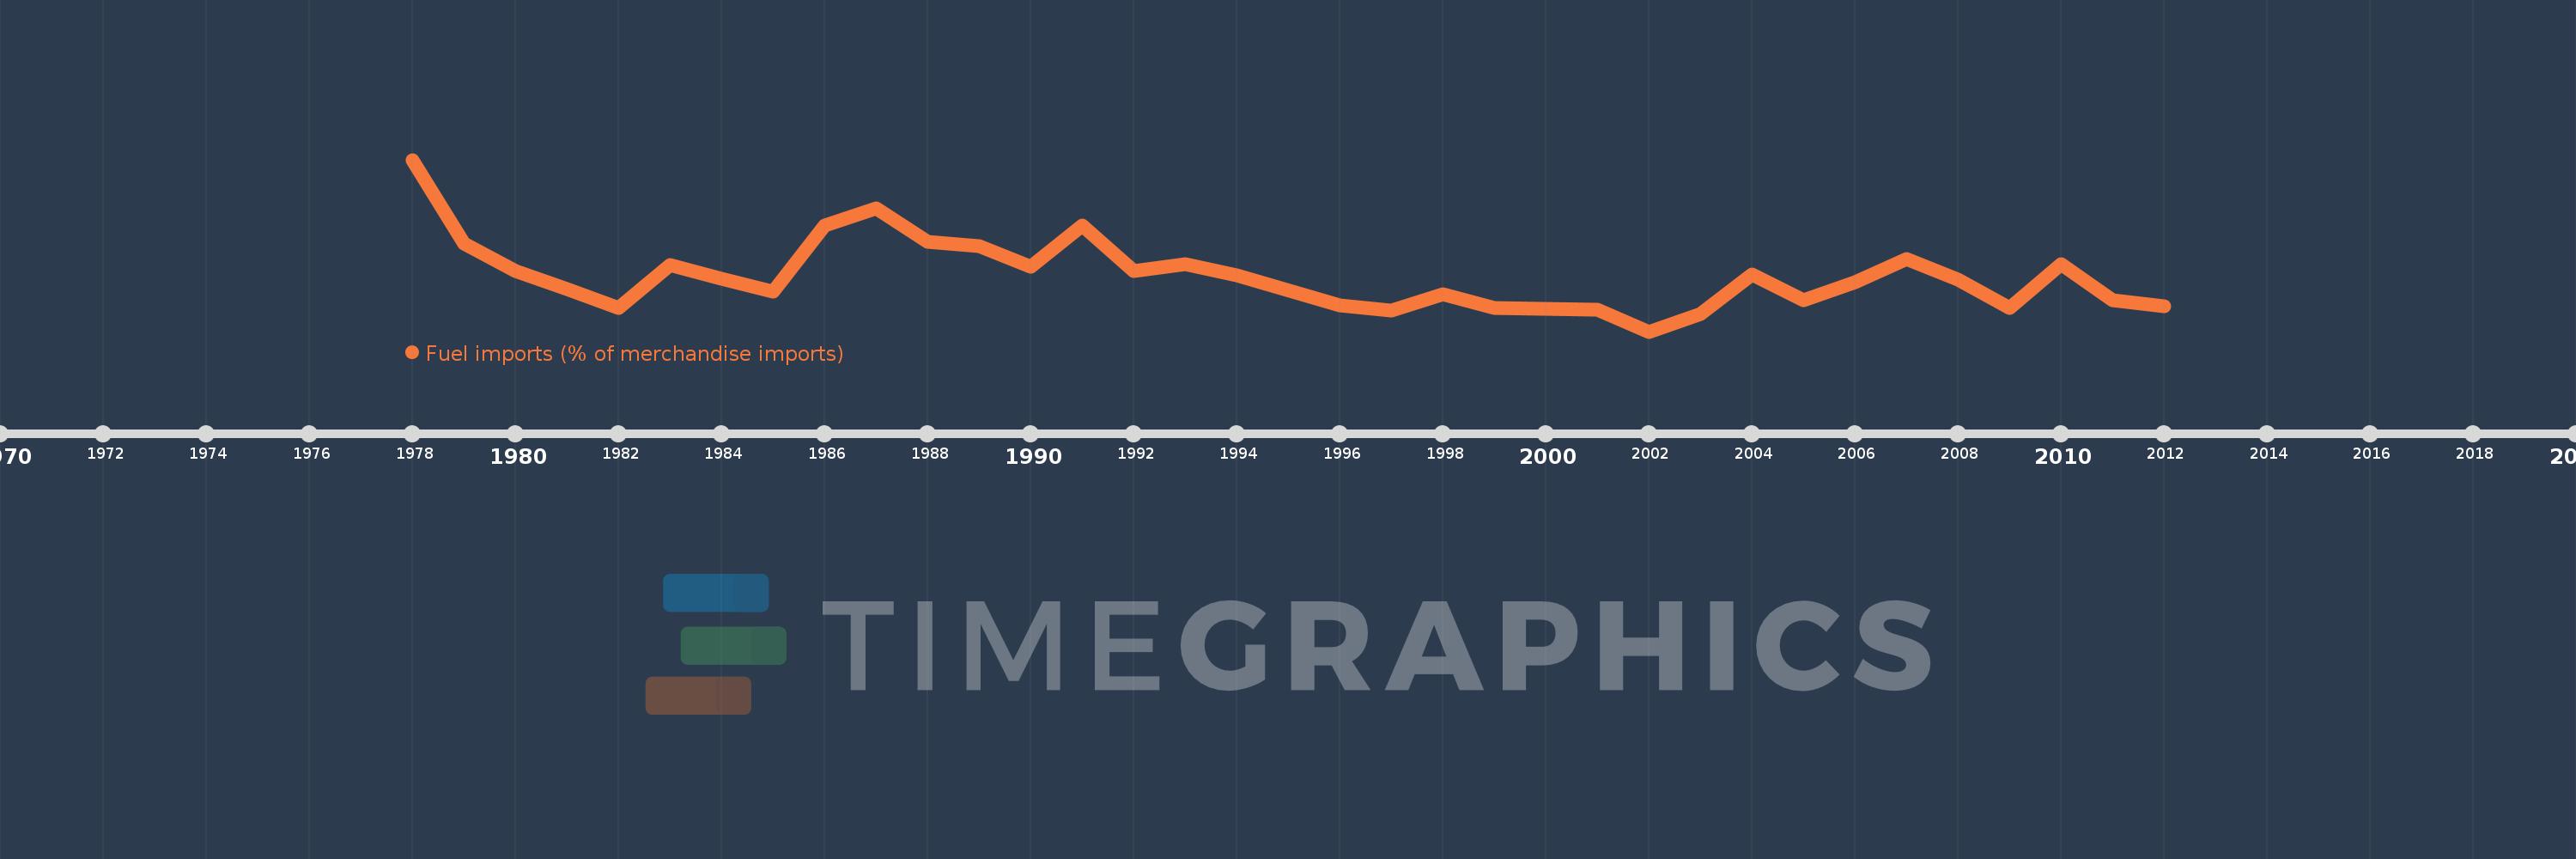
Fuel imports (% of merchandise imports)
2012,2011,2010,2009,2008,2007,2006,2005,2004,2003,2002,2001,1999,1998,1997,1996,1994,1993,1992,1991,1990,1989,1988,1987,1986,1985,1984,1983,1982,1981,1980,1979,1978
This statistics in other country:
AfghanistanAlbaniaAlgeriaAndorraAngolaAntigua and BarbudaArab WorldArgentinaArmeniaArubaAustraliaAustriaAzerbaijanBahamas, TheBahrainBangladeshBarbadosBelarusBelgiumBelizeBeninBermudaBhutanBoliviaBosnia and HerzegovinaBotswanaBrazilBrunei DarussalamBulgariaBurkina FasoBurundiCabo VerdeCambodiaCameroonCanadaCaribbean small statesCayman IslandsCentral African RepublicCentral Europe and the BalticsChadChileChinaColombiaComorosCongo, Dem. Rep.Congo, Rep.Costa RicaCote d'IvoireCroatiaCubaCyprusCzech RepublicDenmarkDjiboutiDominicaDominican RepublicEarly-demographic dividendEast Asia & PacificEast Asia & Pacific (excluding high income)East Asia & Pacific (IDA & IBRD countries)EcuadorEgypt, Arab Rep.El SalvadorEquatorial GuineaEritreaEstoniaEthiopiaEuro areaEurope & Central AsiaEurope & Central Asia (excluding high income)Europe & Central Asia (IDA & IBRD countries)European UnionFaroe IslandsFijiFinlandFragile and conflict affected situationsFranceFrench PolynesiaGabonGambia, TheGeorgiaGermanyGhanaGreeceGreenlandGrenadaGuatemalaGuineaGuinea-BissauGuyanaHaitiHeavily indebted poor countries (HIPC)High incomeHondurasHong Kong SAR, ChinaHungaryIBRD onlyIcelandIDA & IBRD totalIDA blendIDA onlyIDA totalIndiaIndonesiaIran, Islamic Rep.IraqIrelandIsraelItalyJamaicaJapanJordanKazakhstanKenyaKiribatiKorea, Rep.KuwaitKyrgyz RepublicLao PDRLate-demographic dividendLatin America & Caribbean Latin America & Caribbean (excluding high income)Latin America & the Caribbean (IDA & IBRD countries)LatviaLeast developed countries: UN classificationLebanonLesothoLiberiaLibyaLithuaniaLow & middle incomeLow incomeLower middle incomeLuxembourgMacao SAR, ChinaMacedonia, FYRMadagascarMalawiMalaysiaMaldivesMaliMaltaMauritaniaMauritiusMexicoMiddle East & North AfricaMiddle East & North Africa (excluding high income)Middle East & North Africa (IDA & IBRD countries)Middle incomeMoldovaMongoliaMoroccoMozambiqueMyanmarNamibiaNepalNetherlandsNew CaledoniaNew ZealandNicaraguaNigerNigeriaNorth AmericaNorwayOECD membersOmanOther small statesPacific island small statesPakistanPalauPanamaPapua New GuineaParaguayPeruPhilippinesPolandPortugalPost-demographic dividendPre-demographic dividendQatarRomaniaRussian FederationRwandaSamoaSao Tome and PrincipeSaudi ArabiaSenegalSerbiaSeychellesSierra LeoneSingaporeSlovak RepublicSloveniaSmall statesSolomon IslandsSomaliaSouth AfricaSouth AsiaSouth Asia (IDA & IBRD)SpainSri LankaSt. Kitts and NevisSt. LuciaSt. Vincent and the GrenadinesSub-Saharan Africa Sub-Saharan Africa (excluding high income)Sub-Saharan Africa (IDA & IBRD countries)SudanSurinameSwazilandSwedenSwitzerlandSyrian Arab RepublicTajikistanTanzaniaThailandTimor-LesteTogoTongaTrinidad and TobagoTunisiaTurkeyTurkmenistanTurks and Caicos IslandsTuvaluUgandaUkraineUnited Arab EmiratesUnited KingdomUnited StatesUpper middle incomeUruguayVanuatuVenezuela, RBVietnamVirgin Islands (U.S.)WorldYemen, Rep.ZambiaZimbabwe Timeline:
This timeline shows a graph from 1978 to 2012 of Bangladesh. No data until 1977. Number of actual observations by date: 33.
Source name:
World Development Indicators
Source organization:
World Bank staff estimates from the Comtrade database maintained by the United Nations Statistics Division.
Categories, topics:
Energy & Mining, Private Sector, Trade
Last updated:
apr 23, 2017
Indicators value changes by year
Maximum:
23.689
jan 1, 1978
At the date of observation
Value
Absolute change
Change from previous value
jan 1, 1978
23.689
+23.689
0.0%
jan 1, 1979
14.548
-9.141
-38.59%
jan 1, 1980
11.47
-3.078
-21.16%
jan 1, 1981
9.5
-1.97
-17.18%
jan 1, 1982
7.478
-2.022
-21.28%
jan 1, 1983
12.178
+4.7
62.86%
jan 1, 1984
10.66
-1.518
-12.47%
jan 1, 1985
9.268
-1.392
-13.06%
jan 1, 1986
16.535
+7.267
78.41%
jan 1, 1987
18.345
+1.81
10.95%
jan 1, 1988
14.699
-3.646
-19.87%
jan 1, 1989
14.239
-0.46
-3.13%
jan 1, 1990
12.002
-2.237
-15.71%
jan 1, 1991
16.49
+4.488
37.4%
jan 1, 1992
11.458
-5.032
-30.52%
jan 1, 1993
12.223
+0.765
6.68%
jan 1, 1994
11.048
-1.174
-9.61%
jan 1, 1996
7.725
-3.324
-30.08%
jan 1, 1997
7.163
-0.562
-7.27%
jan 1, 1998
8.981
+1.818
25.39%
jan 1, 1999
7.479
-1.502
-16.72%
jan 1, 2001
7.304
-0.175
-2.34%
jan 1, 2002
4.868
-2.436
-33.36%
jan 1, 2003
6.837
+1.969
40.45%
jan 1, 2004
11.149
+4.312
63.07%
jan 1, 2005
8.334
-2.815
-25.25%
jan 1, 2006
10.241
+1.908
22.89%
jan 1, 2007
12.801
+2.56
24.99%
jan 1, 2008
10.525
-2.276
-17.78%
jan 1, 2009
7.443
-3.082
-29.28%
jan 1, 2010
12.271
+4.828
64.86%
jan 1, 2011
8.338
-3.933
-32.05%
jan 1, 2012
7.619
-0.719
-8.63%
Ranking of countries by current statistics by years


Comments: