29
/
en
AIzaSyAYiBZKx7MnpbEhh9jyipgxe19OcubqV5w
April 1, 2024
163747
Japan
JPN
true
2
1
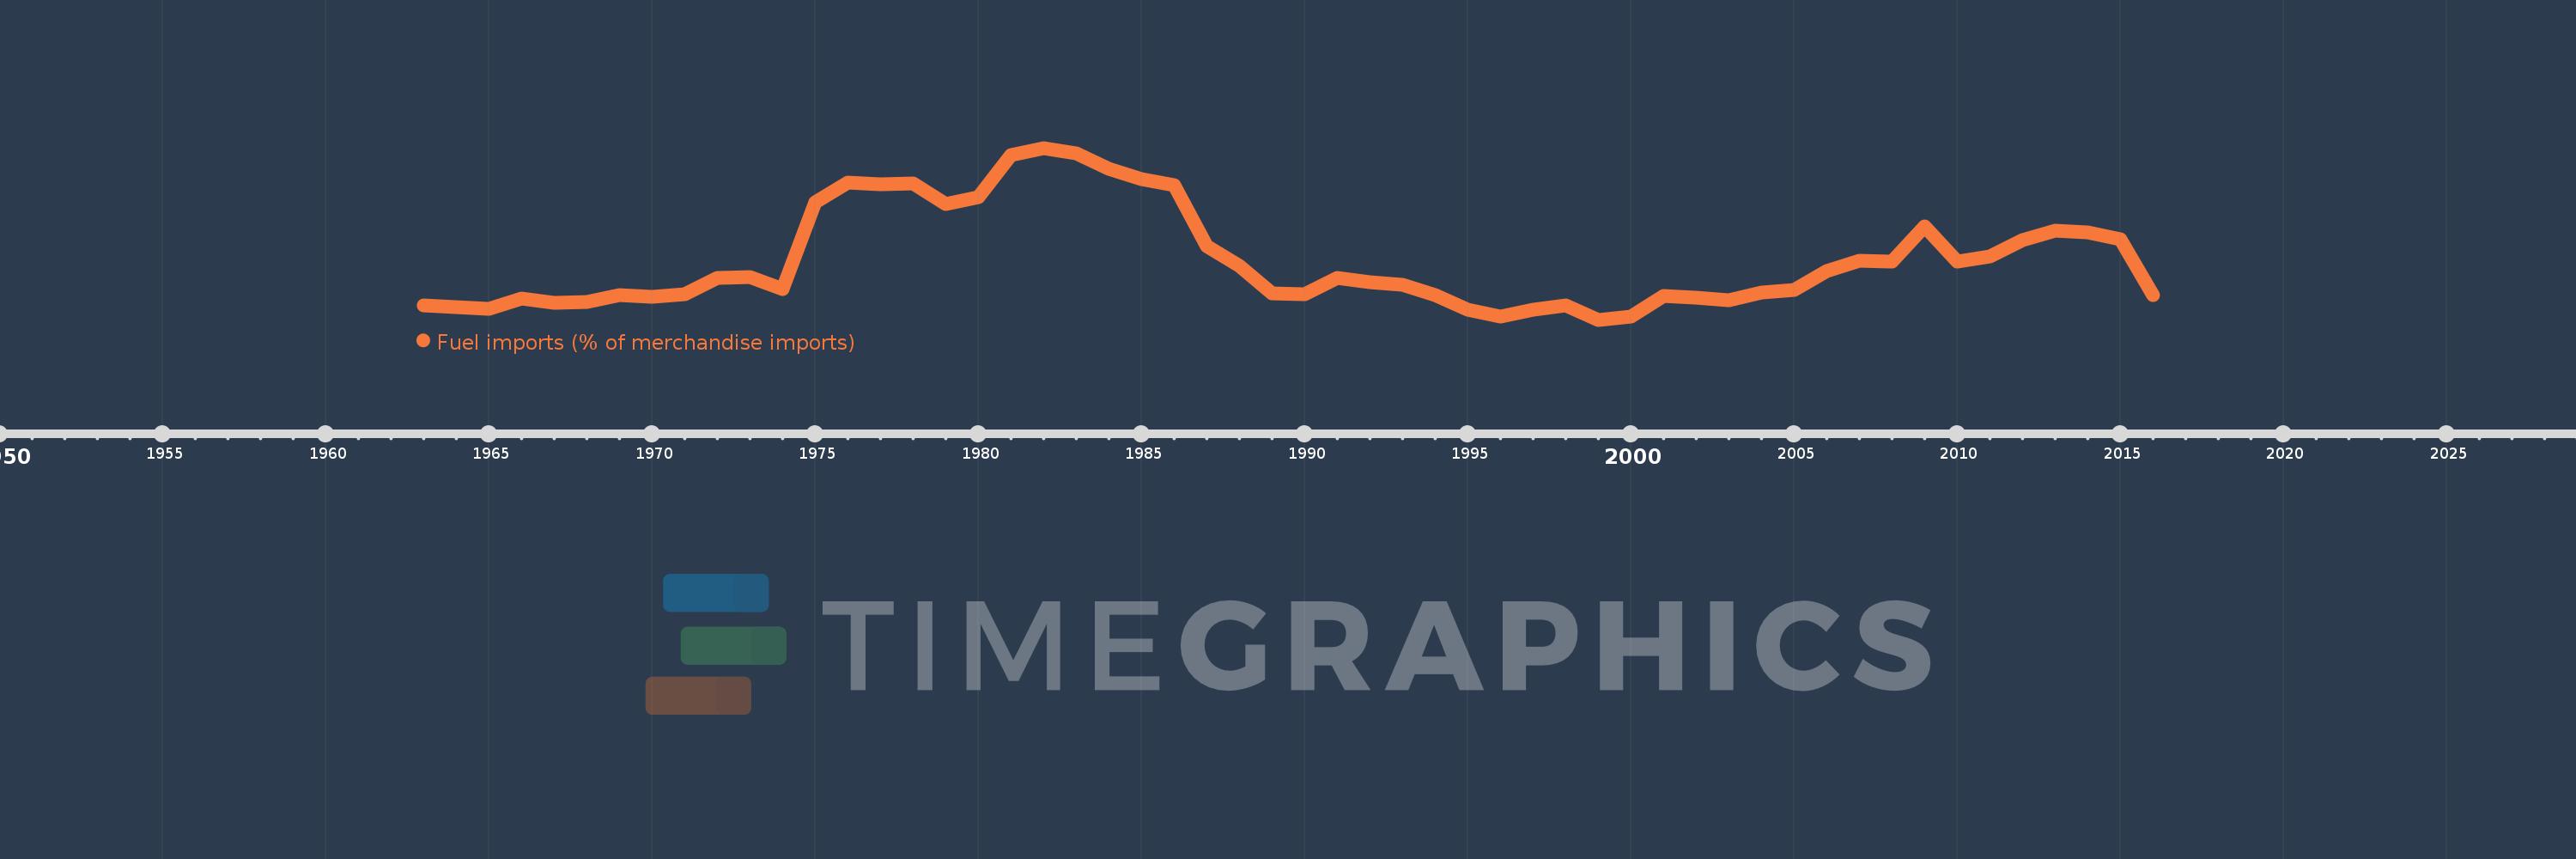
Fuel imports (% of merchandise imports)
2016,2015,2014,2013,2012,2011,2010,2009,2008,2007,2006,2005,2004,2003,2002,2001,2000,1999,1998,1997,1996,1995,1994,1993,1992,1991,1990,1989,1988,1987,1986,1985,1984,1983,1982,1981,1980,1979,1978,1977,1976,1975,1974,1973,1972,1971,1970,1969,1968,1967,1966,1965,1964,1963
This statistics in other country:
AfghanistanAlbaniaAlgeriaAndorraAngolaAntigua and BarbudaArab WorldArgentinaArmeniaArubaAustraliaAustriaAzerbaijanBahamas, TheBahrainBangladeshBarbadosBelarusBelgiumBelizeBeninBermudaBhutanBoliviaBosnia and HerzegovinaBotswanaBrazilBrunei DarussalamBulgariaBurkina FasoBurundiCabo VerdeCambodiaCameroonCanadaCaribbean small statesCayman IslandsCentral African RepublicCentral Europe and the BalticsChadChileChinaColombiaComorosCongo, Dem. Rep.Congo, Rep.Costa RicaCote d'IvoireCroatiaCubaCyprusCzech RepublicDenmarkDjiboutiDominicaDominican RepublicEarly-demographic dividendEast Asia & PacificEast Asia & Pacific (excluding high income)East Asia & Pacific (IDA & IBRD countries)EcuadorEgypt, Arab Rep.El SalvadorEquatorial GuineaEritreaEstoniaEthiopiaEuro areaEurope & Central AsiaEurope & Central Asia (excluding high income)Europe & Central Asia (IDA & IBRD countries)European UnionFaroe IslandsFijiFinlandFragile and conflict affected situationsFranceFrench PolynesiaGabonGambia, TheGeorgiaGermanyGhanaGreeceGreenlandGrenadaGuatemalaGuineaGuinea-BissauGuyanaHaitiHeavily indebted poor countries (HIPC)High incomeHondurasHong Kong SAR, ChinaHungaryIBRD onlyIcelandIDA & IBRD totalIDA blendIDA onlyIDA totalIndiaIndonesiaIran, Islamic Rep.IraqIrelandIsraelItalyJamaicaJapanJordanKazakhstanKenyaKiribatiKorea, Rep.KuwaitKyrgyz RepublicLao PDRLate-demographic dividendLatin America & Caribbean Latin America & Caribbean (excluding high income)Latin America & the Caribbean (IDA & IBRD countries)LatviaLeast developed countries: UN classificationLebanonLesothoLiberiaLibyaLithuaniaLow & middle incomeLow incomeLower middle incomeLuxembourgMacao SAR, ChinaMacedonia, FYRMadagascarMalawiMalaysiaMaldivesMaliMaltaMauritaniaMauritiusMexicoMiddle East & North AfricaMiddle East & North Africa (excluding high income)Middle East & North Africa (IDA & IBRD countries)Middle incomeMoldovaMongoliaMoroccoMozambiqueMyanmarNamibiaNepalNetherlandsNew CaledoniaNew ZealandNicaraguaNigerNigeriaNorth AmericaNorwayOECD membersOmanOther small statesPacific island small statesPakistanPalauPanamaPapua New GuineaParaguayPeruPhilippinesPolandPortugalPost-demographic dividendPre-demographic dividendQatarRomaniaRussian FederationRwandaSamoaSao Tome and PrincipeSaudi ArabiaSenegalSerbiaSeychellesSierra LeoneSingaporeSlovak RepublicSloveniaSmall statesSolomon IslandsSomaliaSouth AfricaSouth AsiaSouth Asia (IDA & IBRD)SpainSri LankaSt. Kitts and NevisSt. LuciaSt. Vincent and the GrenadinesSub-Saharan Africa Sub-Saharan Africa (excluding high income)Sub-Saharan Africa (IDA & IBRD countries)SudanSurinameSwazilandSwedenSwitzerlandSyrian Arab RepublicTajikistanTanzaniaThailandTimor-LesteTogoTongaTrinidad and TobagoTunisiaTurkeyTurkmenistanTurks and Caicos IslandsTuvaluUgandaUkraineUnited Arab EmiratesUnited KingdomUnited StatesUpper middle incomeUruguayVanuatuVenezuela, RBVietnamVirgin Islands (U.S.)WorldYemen, Rep.ZambiaZimbabwe Timeline:
This timeline shows a graph from 1963 to 2016 of Japan. No data until 1962. Number of actual observations by date: 54.
Source name:
World Development Indicators
Source organization:
World Bank staff estimates from the Comtrade database maintained by the United Nations Statistics Division.
Categories, topics:
Energy & Mining, Private Sector, Trade
Last updated:
apr 23, 2017
Indicators value changes by year
Minimum:
15.403
jan 1, 1999
Maximum:
51.525
jan 1, 1982
At the date of observation
Value
Absolute change
Change from previous value
jan 1, 1963
18.474
+18.474
0.0%
jan 1, 1964
17.974
-0.5
-2.71%
jan 1, 1965
17.731
-0.243
-1.35%
jan 1, 1966
19.88
+2.149
12.12%
jan 1, 1967
18.941
-0.939
-4.72%
jan 1, 1968
19.201
+0.26
1.38%
jan 1, 1969
20.597
+1.396
7.27%
jan 1, 1970
20.261
-0.336
-1.63%
jan 1, 1971
20.684
+0.423
2.09%
jan 1, 1972
24.114
+3.429
16.58%
jan 1, 1973
24.35
+0.236
0.98%
jan 1, 1974
21.778
-2.573
-10.56%
jan 1, 1975
40.133
+18.356
84.29%
jan 1, 1976
44.331
+4.198
10.46%
jan 1, 1977
43.853
-0.478
-1.08%
jan 1, 1978
44.145
+0.292
0.66%
jan 1, 1979
39.802
-4.343
-9.84%
jan 1, 1980
41.129
+1.327
3.33%
jan 1, 1981
50.032
+8.904
21.65%
jan 1, 1982
51.525
+1.492
2.98%
jan 1, 1983
50.352
-1.173
-2.28%
jan 1, 1984
47.133
-3.219
-6.39%
jan 1, 1985
44.941
-2.192
-4.65%
jan 1, 1986
43.753
-1.188
-2.64%
jan 1, 1987
30.902
-12.851
-29.37%
jan 1, 1988
26.797
-4.104
-13.28%
jan 1, 1989
20.915
-5.882
-21.95%
jan 1, 1990
20.765
-0.151
-0.72%
jan 1, 1991
24.252
+3.488
16.8%
jan 1, 1992
23.357
-0.895
-3.69%
jan 1, 1993
22.824
-0.533
-2.28%
jan 1, 1994
20.583
-2.242
-9.82%
jan 1, 1995
17.567
-3.016
-14.65%
jan 1, 1996
16.087
-1.48
-8.42%
jan 1, 1997
17.435
+1.348
8.38%
jan 1, 1998
18.501
+1.066
6.11%
jan 1, 1999
15.403
-3.098
-16.74%
jan 1, 2000
16.076
+0.673
4.37%
jan 1, 2001
20.364
+4.289
26.68%
jan 1, 2002
20.132
-0.232
-1.14%
jan 1, 2003
19.422
-0.71
-3.53%
jan 1, 2004
21.127
+1.704
8.78%
jan 1, 2005
21.75
+0.623
2.95%
jan 1, 2006
25.643
+3.894
17.9%
jan 1, 2007
27.757
+2.114
8.24%
jan 1, 2008
27.68
-0.077
-0.28%
jan 1, 2009
35.096
+7.416
26.79%
jan 1, 2010
27.625
-7.471
-21.29%
jan 1, 2011
28.684
+1.058
3.83%
jan 1, 2012
32.074
+3.39
11.82%
jan 1, 2013
34.119
+2.045
6.38%
jan 1, 2014
33.821
-0.298
-0.87%
jan 1, 2015
32.274
-1.547
-4.58%
jan 1, 2016
20.515
-11.759
-36.43%
Ranking of countries by current statistics by years


Comments: