29
/
en
AIzaSyAYiBZKx7MnpbEhh9jyipgxe19OcubqV5w
April 1, 2024
267973
Tunisia
TUN
true
2
1
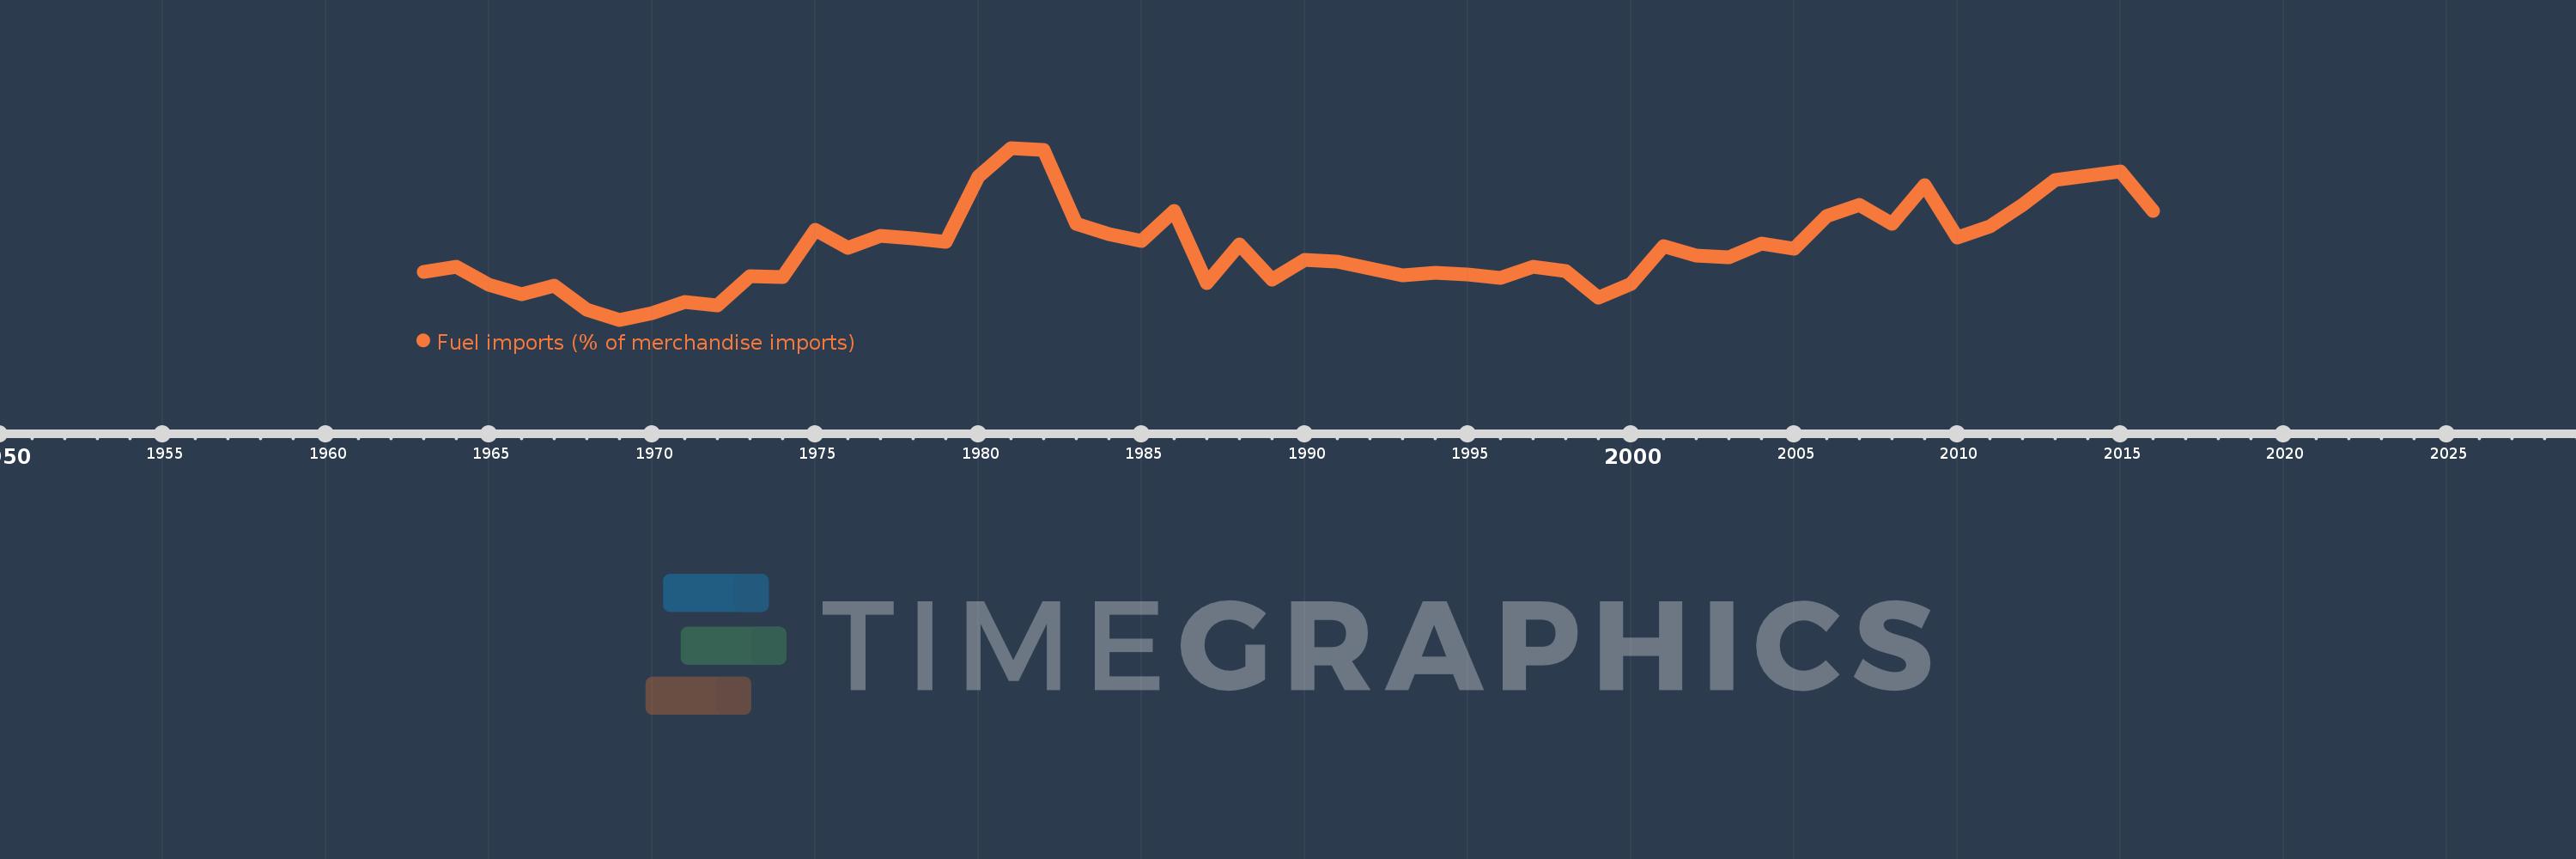
Fuel imports (% of merchandise imports)
2016,2015,2014,2013,2012,2011,2010,2009,2008,2007,2006,2005,2004,2003,2002,2001,2000,1999,1998,1997,1996,1995,1994,1993,1992,1991,1990,1989,1988,1987,1986,1985,1984,1983,1982,1981,1980,1979,1978,1977,1976,1975,1974,1973,1972,1971,1970,1969,1968,1967,1966,1965,1964,1963
This statistics in other country:
AfghanistanAlbaniaAlgeriaAndorraAngolaAntigua and BarbudaArab WorldArgentinaArmeniaArubaAustraliaAustriaAzerbaijanBahamas, TheBahrainBangladeshBarbadosBelarusBelgiumBelizeBeninBermudaBhutanBoliviaBosnia and HerzegovinaBotswanaBrazilBrunei DarussalamBulgariaBurkina FasoBurundiCabo VerdeCambodiaCameroonCanadaCaribbean small statesCayman IslandsCentral African RepublicCentral Europe and the BalticsChadChileChinaColombiaComorosCongo, Dem. Rep.Congo, Rep.Costa RicaCote d'IvoireCroatiaCubaCyprusCzech RepublicDenmarkDjiboutiDominicaDominican RepublicEarly-demographic dividendEast Asia & PacificEast Asia & Pacific (excluding high income)East Asia & Pacific (IDA & IBRD countries)EcuadorEgypt, Arab Rep.El SalvadorEquatorial GuineaEritreaEstoniaEthiopiaEuro areaEurope & Central AsiaEurope & Central Asia (excluding high income)Europe & Central Asia (IDA & IBRD countries)European UnionFaroe IslandsFijiFinlandFragile and conflict affected situationsFranceFrench PolynesiaGabonGambia, TheGeorgiaGermanyGhanaGreeceGreenlandGrenadaGuatemalaGuineaGuinea-BissauGuyanaHaitiHeavily indebted poor countries (HIPC)High incomeHondurasHong Kong SAR, ChinaHungaryIBRD onlyIcelandIDA & IBRD totalIDA blendIDA onlyIDA totalIndiaIndonesiaIran, Islamic Rep.IraqIrelandIsraelItalyJamaicaJapanJordanKazakhstanKenyaKiribatiKorea, Rep.KuwaitKyrgyz RepublicLao PDRLate-demographic dividendLatin America & Caribbean Latin America & Caribbean (excluding high income)Latin America & the Caribbean (IDA & IBRD countries)LatviaLeast developed countries: UN classificationLebanonLesothoLiberiaLibyaLithuaniaLow & middle incomeLow incomeLower middle incomeLuxembourgMacao SAR, ChinaMacedonia, FYRMadagascarMalawiMalaysiaMaldivesMaliMaltaMauritaniaMauritiusMexicoMiddle East & North AfricaMiddle East & North Africa (excluding high income)Middle East & North Africa (IDA & IBRD countries)Middle incomeMoldovaMongoliaMoroccoMozambiqueMyanmarNamibiaNepalNetherlandsNew CaledoniaNew ZealandNicaraguaNigerNigeriaNorth AmericaNorwayOECD membersOmanOther small statesPacific island small statesPakistanPalauPanamaPapua New GuineaParaguayPeruPhilippinesPolandPortugalPost-demographic dividendPre-demographic dividendQatarRomaniaRussian FederationRwandaSamoaSao Tome and PrincipeSaudi ArabiaSenegalSerbiaSeychellesSierra LeoneSingaporeSlovak RepublicSloveniaSmall statesSolomon IslandsSomaliaSouth AfricaSouth AsiaSouth Asia (IDA & IBRD)SpainSri LankaSt. Kitts and NevisSt. LuciaSt. Vincent and the GrenadinesSub-Saharan Africa Sub-Saharan Africa (excluding high income)Sub-Saharan Africa (IDA & IBRD countries)SudanSurinameSwazilandSwedenSwitzerlandSyrian Arab RepublicTajikistanTanzaniaThailandTimor-LesteTogoTongaTrinidad and TobagoTunisiaTurkeyTurkmenistanTurks and Caicos IslandsTuvaluUgandaUkraineUnited Arab EmiratesUnited KingdomUnited StatesUpper middle incomeUruguayVanuatuVenezuela, RBVietnamVirgin Islands (U.S.)WorldYemen, Rep.ZambiaZimbabwe Timeline:
This timeline shows a graph from 1963 to 2016 of Tunisia. No data until 1962. Number of actual observations by date: 54.
Source name:
World Development Indicators
Source organization:
World Bank staff estimates from the Comtrade database maintained by the United Nations Statistics Division.
Categories, topics:
Energy & Mining, Private Sector, Trade
Last updated:
apr 23, 2017
Indicators value changes by year
Maximum:
20.737
jan 1, 1981
At the date of observation
Value
Absolute change
Change from previous value
jan 1, 1963
7.947
+7.947
0.0%
jan 1, 1964
8.475
+0.528
6.64%
jan 1, 1965
6.567
-1.907
-22.51%
jan 1, 1966
5.657
-0.91
-13.86%
jan 1, 1967
6.486
+0.829
14.65%
jan 1, 1968
4.054
-2.431
-37.49%
jan 1, 1969
2.992
-1.062
-26.2%
jan 1, 1970
3.654
+0.662
22.11%
jan 1, 1971
4.84
+1.186
32.46%
jan 1, 1972
4.506
-0.334
-6.9%
jan 1, 1973
7.489
+2.984
66.22%
jan 1, 1974
7.371
-0.119
-1.58%
jan 1, 1975
12.303
+4.933
66.93%
jan 1, 1976
10.405
-1.898
-15.43%
jan 1, 1977
11.675
+1.27
12.21%
jan 1, 1978
11.354
-0.321
-2.75%
jan 1, 1979
11.026
-0.328
-2.89%
jan 1, 1980
17.755
+6.728
61.02%
jan 1, 1981
20.737
+2.982
16.8%
jan 1, 1982
20.524
-0.213
-1.03%
jan 1, 1983
12.936
-7.588
-36.97%
jan 1, 1984
11.825
-1.111
-8.59%
jan 1, 1985
11.165
-0.66
-5.58%
jan 1, 1986
14.218
+3.053
27.35%
jan 1, 1987
6.806
-7.412
-52.13%
jan 1, 1988
10.813
+4.008
58.89%
jan 1, 1989
7.096
-3.717
-34.37%
jan 1, 1990
9.208
+2.112
29.76%
jan 1, 1991
9.028
-0.181
-1.96%
jan 1, 1992
8.251
-0.776
-8.6%
jan 1, 1993
7.56
-0.692
-8.38%
jan 1, 1994
7.857
+0.297
3.93%
jan 1, 1995
7.666
-0.191
-2.43%
jan 1, 1996
7.287
-0.379
-4.95%
jan 1, 1997
8.429
+1.142
15.67%
jan 1, 1998
7.998
-0.431
-5.11%
jan 1, 1999
5.236
-2.762
-34.53%
jan 1, 2000
6.72
+1.484
28.34%
jan 1, 2001
10.587
+3.868
57.56%
jan 1, 2002
9.643
-0.944
-8.92%
jan 1, 2003
9.412
-0.231
-2.39%
jan 1, 2004
10.848
+1.435
15.25%
jan 1, 2005
10.32
-0.528
-4.87%
jan 1, 2006
13.728
+3.409
33.03%
jan 1, 2007
14.844
+1.115
8.12%
jan 1, 2008
12.859
-1.984
-13.37%
jan 1, 2009
16.899
+4.039
31.41%
jan 1, 2010
11.467
-5.432
-32.15%
jan 1, 2011
12.61
+1.143
9.97%
jan 1, 2012
14.841
+2.231
17.7%
jan 1, 2013
17.435
+2.594
17.48%
jan 1, 2014
17.834
+0.399
2.29%
jan 1, 2015
18.335
+0.502
2.81%
jan 1, 2016
14.272
-4.064
-22.16%
Ranking of countries by current statistics by years


Comments: