29
/
en
AIzaSyAYiBZKx7MnpbEhh9jyipgxe19OcubqV5w
April 1, 2024
30675
Europe & Central Asia
ECS
false
2
1
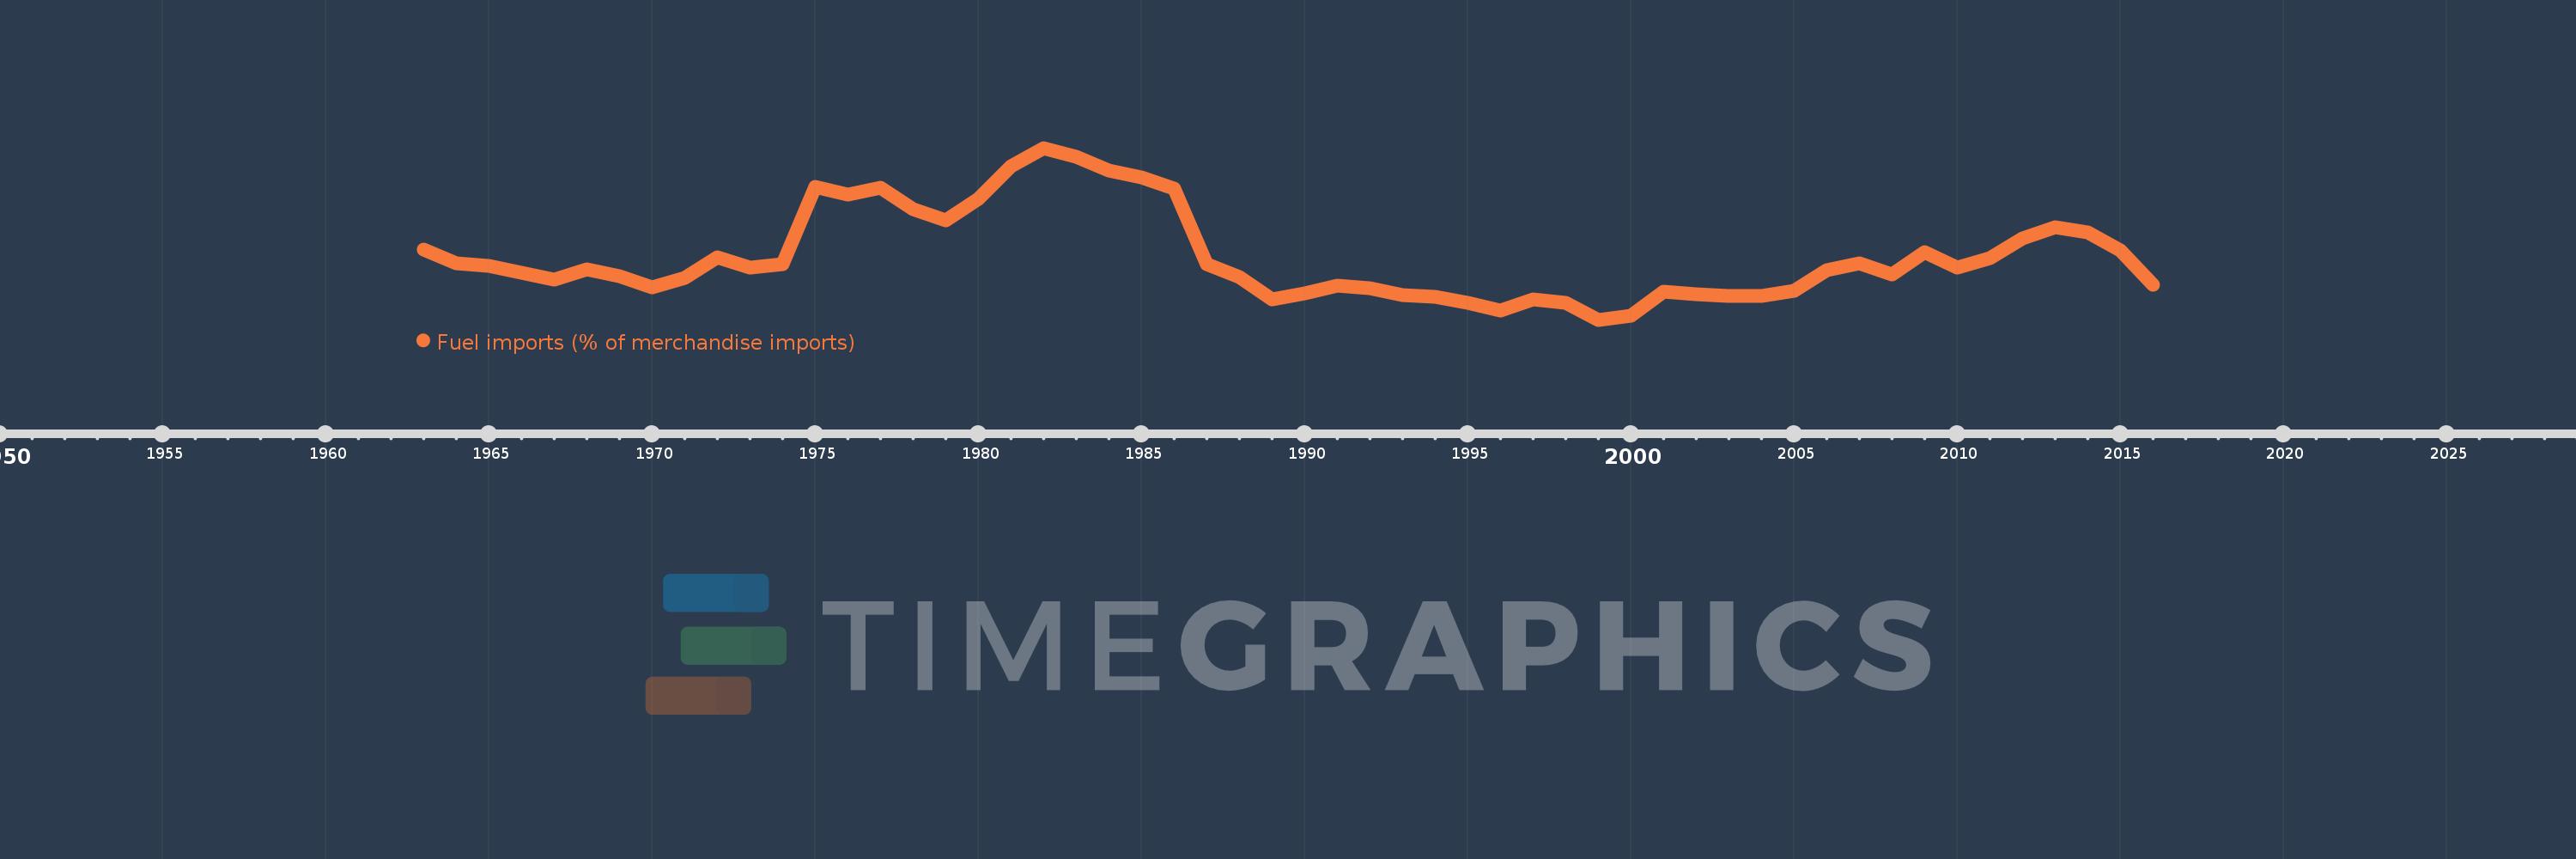
Fuel imports (% of merchandise imports)
2016,2015,2014,2013,2012,2011,2010,2009,2008,2007,2006,2005,2004,2003,2002,2001,2000,1999,1998,1997,1996,1995,1994,1993,1992,1991,1990,1989,1988,1987,1986,1985,1984,1983,1982,1981,1980,1979,1978,1977,1976,1975,1974,1973,1972,1971,1970,1969,1968,1967,1966,1965,1964,1963
This statistics in other country:
AfghanistanAlbaniaAlgeriaAndorraAngolaAntigua and BarbudaArab WorldArgentinaArmeniaArubaAustraliaAustriaAzerbaijanBahamas, TheBahrainBangladeshBarbadosBelarusBelgiumBelizeBeninBermudaBhutanBoliviaBosnia and HerzegovinaBotswanaBrazilBrunei DarussalamBulgariaBurkina FasoBurundiCabo VerdeCambodiaCameroonCanadaCaribbean small statesCayman IslandsCentral African RepublicCentral Europe and the BalticsChadChileChinaColombiaComorosCongo, Dem. Rep.Congo, Rep.Costa RicaCote d'IvoireCroatiaCubaCyprusCzech RepublicDenmarkDjiboutiDominicaDominican RepublicEarly-demographic dividendEast Asia & PacificEast Asia & Pacific (excluding high income)East Asia & Pacific (IDA & IBRD countries)EcuadorEgypt, Arab Rep.El SalvadorEquatorial GuineaEritreaEstoniaEthiopiaEuro areaEurope & Central AsiaEurope & Central Asia (excluding high income)Europe & Central Asia (IDA & IBRD countries)European UnionFaroe IslandsFijiFinlandFragile and conflict affected situationsFranceFrench PolynesiaGabonGambia, TheGeorgiaGermanyGhanaGreeceGreenlandGrenadaGuatemalaGuineaGuinea-BissauGuyanaHaitiHeavily indebted poor countries (HIPC)High incomeHondurasHong Kong SAR, ChinaHungaryIBRD onlyIcelandIDA & IBRD totalIDA blendIDA onlyIDA totalIndiaIndonesiaIran, Islamic Rep.IraqIrelandIsraelItalyJamaicaJapanJordanKazakhstanKenyaKiribatiKorea, Rep.KuwaitKyrgyz RepublicLao PDRLate-demographic dividendLatin America & Caribbean Latin America & Caribbean (excluding high income)Latin America & the Caribbean (IDA & IBRD countries)LatviaLeast developed countries: UN classificationLebanonLesothoLiberiaLibyaLithuaniaLow & middle incomeLow incomeLower middle incomeLuxembourgMacao SAR, ChinaMacedonia, FYRMadagascarMalawiMalaysiaMaldivesMaliMaltaMauritaniaMauritiusMexicoMiddle East & North AfricaMiddle East & North Africa (excluding high income)Middle East & North Africa (IDA & IBRD countries)Middle incomeMoldovaMongoliaMoroccoMozambiqueMyanmarNamibiaNepalNetherlandsNew CaledoniaNew ZealandNicaraguaNigerNigeriaNorth AmericaNorwayOECD membersOmanOther small statesPacific island small statesPakistanPalauPanamaPapua New GuineaParaguayPeruPhilippinesPolandPortugalPost-demographic dividendPre-demographic dividendQatarRomaniaRussian FederationRwandaSamoaSao Tome and PrincipeSaudi ArabiaSenegalSerbiaSeychellesSierra LeoneSingaporeSlovak RepublicSloveniaSmall statesSolomon IslandsSomaliaSouth AfricaSouth AsiaSouth Asia (IDA & IBRD)SpainSri LankaSt. Kitts and NevisSt. LuciaSt. Vincent and the GrenadinesSub-Saharan Africa Sub-Saharan Africa (excluding high income)Sub-Saharan Africa (IDA & IBRD countries)SudanSurinameSwazilandSwedenSwitzerlandSyrian Arab RepublicTajikistanTanzaniaThailandTimor-LesteTogoTongaTrinidad and TobagoTunisiaTurkeyTurkmenistanTurks and Caicos IslandsTuvaluUgandaUkraineUnited Arab EmiratesUnited KingdomUnited StatesUpper middle incomeUruguayVanuatuVenezuela, RBVietnamVirgin Islands (U.S.)WorldYemen, Rep.ZambiaZimbabwe Timeline:
This timeline shows a graph from 1963 to 2016 of Europe & Central Asia. No data until 1962. Number of actual observations by date: 54.
Source name:
World Development Indicators
Source organization:
World Bank staff estimates from the Comtrade database maintained by the United Nations Statistics Division.
Categories, topics:
Energy & Mining, Private Sector, Trade
Last updated:
apr 23, 2017
Indicators value changes by year
Maximum:
25.413
jan 1, 1982
At the date of observation
Value
Absolute change
Change from previous value
jan 1, 1963
13.987
+13.987
0.0%
jan 1, 1964
12.431
-1.556
-11.12%
jan 1, 1965
12.164
-0.268
-2.15%
jan 1, 1966
11.432
-0.731
-6.01%
jan 1, 1967
10.644
-0.788
-6.9%
jan 1, 1968
11.799
+1.155
10.85%
jan 1, 1969
10.967
-0.832
-7.05%
jan 1, 1970
9.796
-1.172
-10.68%
jan 1, 1971
10.82
+1.024
10.46%
jan 1, 1972
13.11
+2.29
21.16%
jan 1, 1973
12.0
-1.11
-8.47%
jan 1, 1974
12.382
+0.382
3.18%
jan 1, 1975
21.0
+8.618
69.6%
jan 1, 1976
20.197
-0.803
-3.82%
jan 1, 1977
20.941
+0.744
3.69%
jan 1, 1978
18.541
-2.4
-11.46%
jan 1, 1979
17.255
-1.286
-6.94%
jan 1, 1980
19.663
+2.408
13.95%
jan 1, 1981
23.351
+3.689
18.76%
jan 1, 1982
25.413
+2.061
8.83%
jan 1, 1983
24.459
-0.954
-3.76%
jan 1, 1984
22.835
-1.623
-6.64%
jan 1, 1985
22.062
-0.773
-3.39%
jan 1, 1986
20.837
-1.225
-5.55%
jan 1, 1987
12.355
-8.483
-40.71%
jan 1, 1988
10.953
-1.401
-11.34%
jan 1, 1989
8.353
-2.6
-23.73%
jan 1, 1990
9.088
+0.735
8.8%
jan 1, 1991
9.981
+0.892
9.82%
jan 1, 1992
9.637
-0.344
-3.45%
jan 1, 1993
8.92
-0.717
-7.44%
jan 1, 1994
8.648
-0.272
-3.05%
jan 1, 1995
8.011
-0.638
-7.37%
jan 1, 1996
7.118
-0.893
-11.15%
jan 1, 1997
8.36
+1.242
17.45%
jan 1, 1998
7.97
-0.39
-4.67%
jan 1, 1999
6.112
-1.857
-23.3%
jan 1, 2000
6.605
+0.493
8.06%
jan 1, 2001
9.243
+2.637
39.93%
jan 1, 2002
8.975
-0.267
-2.89%
jan 1, 2003
8.777
-0.198
-2.21%
jan 1, 2004
8.74
-0.038
-0.43%
jan 1, 2005
9.344
+0.605
6.92%
jan 1, 2006
11.634
+2.289
24.5%
jan 1, 2007
12.434
+0.8
6.88%
jan 1, 2008
11.2
-1.234
-9.92%
jan 1, 2009
13.662
+2.463
21.99%
jan 1, 2010
11.976
-1.686
-12.34%
jan 1, 2011
13.066
+1.089
9.1%
jan 1, 2012
15.208
+2.142
16.39%
jan 1, 2013
16.477
+1.269
8.35%
jan 1, 2014
15.887
-0.59
-3.58%
jan 1, 2015
13.897
-1.99
-12.53%
jan 1, 2016
10.033
-3.864
-27.81%
Ranking of countries by current statistics by years


Comments: