29
/
en
AIzaSyAYiBZKx7MnpbEhh9jyipgxe19OcubqV5w
April 1, 2024
210359
Nicaragua
NIC
true
2
1
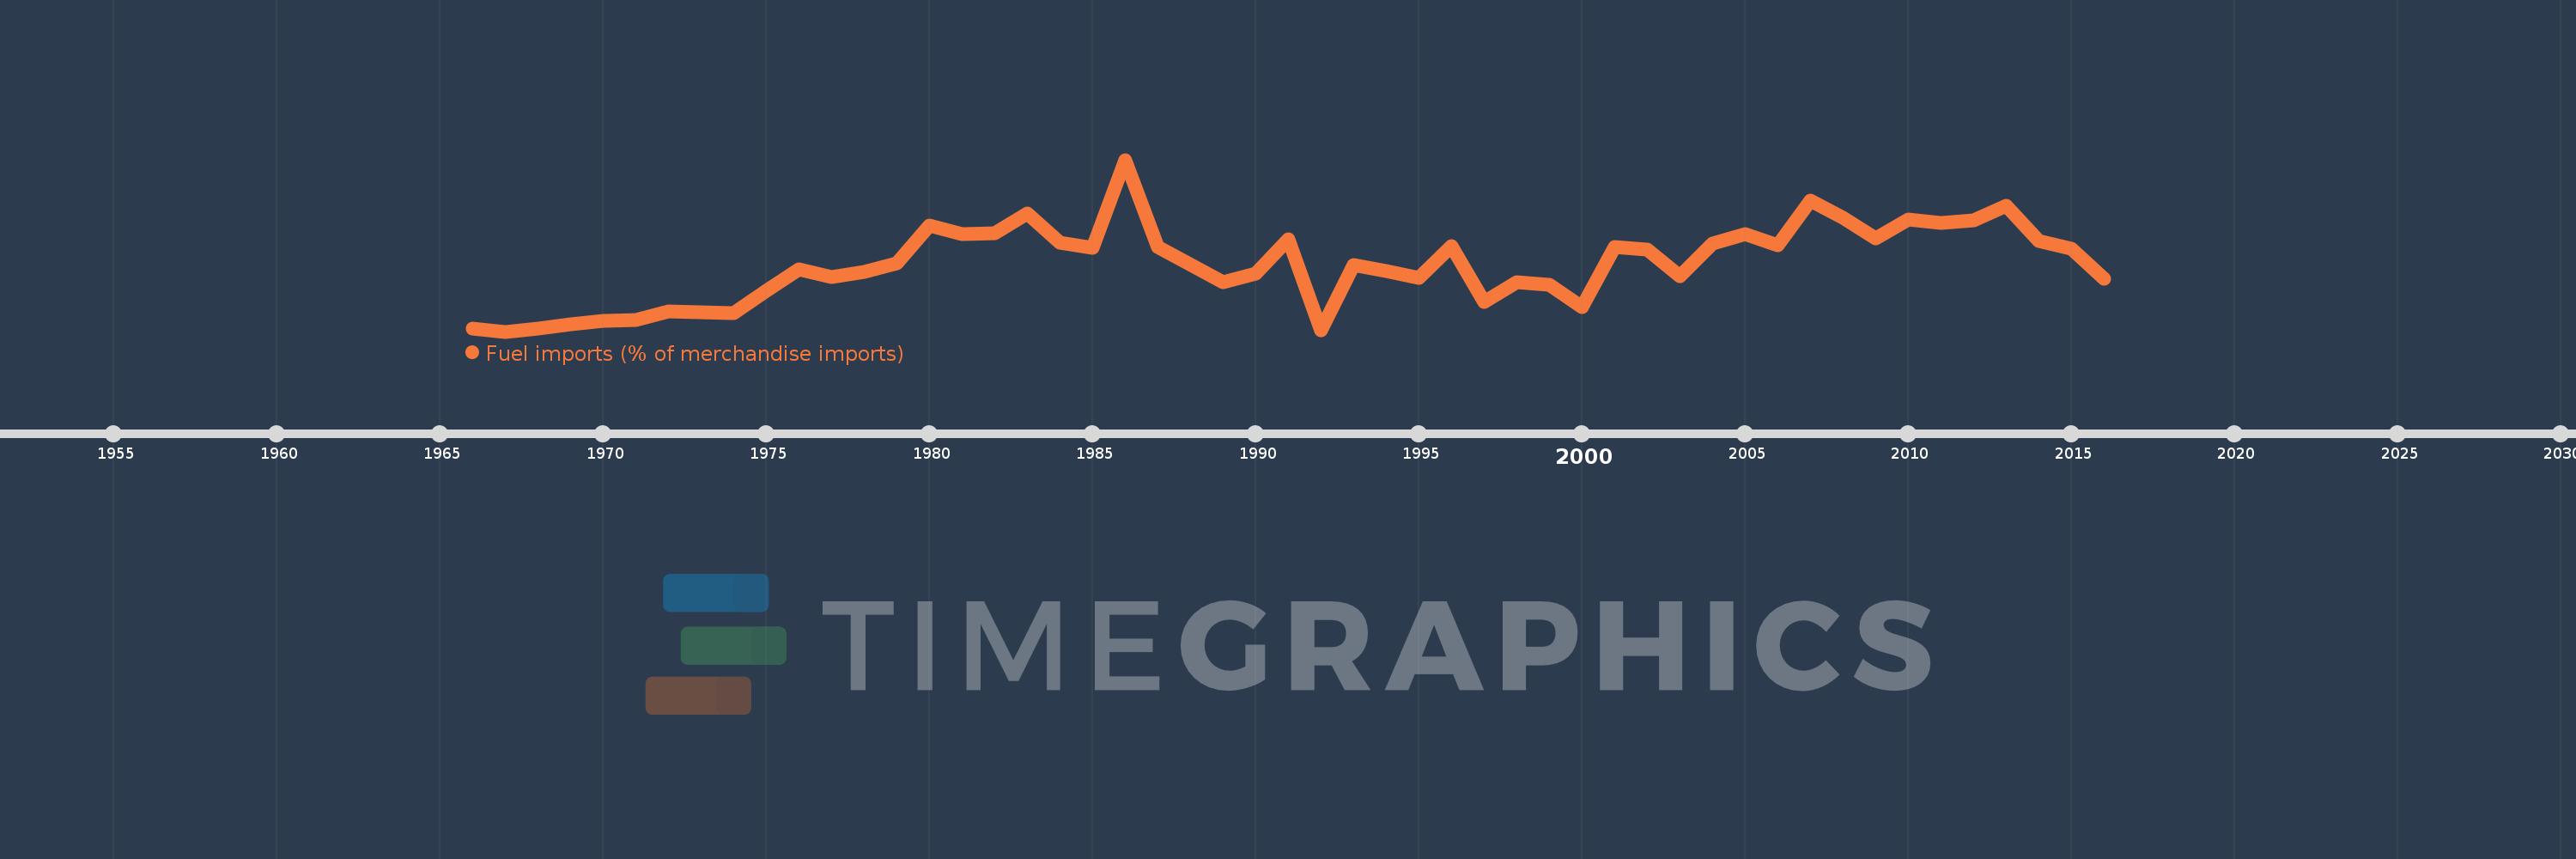
Fuel imports (% of merchandise imports)
2016,2015,2014,2013,2012,2011,2010,2009,2008,2007,2006,2005,2004,2003,2002,2001,2000,1999,1998,1997,1996,1995,1994,1993,1992,1991,1990,1989,1987,1986,1985,1984,1983,1982,1981,1980,1979,1978,1977,1976,1975,1974,1973,1972,1971,1970,1969,1968,1967,1966
This statistics in other country:
AfghanistanAlbaniaAlgeriaAndorraAngolaAntigua and BarbudaArab WorldArgentinaArmeniaArubaAustraliaAustriaAzerbaijanBahamas, TheBahrainBangladeshBarbadosBelarusBelgiumBelizeBeninBermudaBhutanBoliviaBosnia and HerzegovinaBotswanaBrazilBrunei DarussalamBulgariaBurkina FasoBurundiCabo VerdeCambodiaCameroonCanadaCaribbean small statesCayman IslandsCentral African RepublicCentral Europe and the BalticsChadChileChinaColombiaComorosCongo, Dem. Rep.Congo, Rep.Costa RicaCote d'IvoireCroatiaCubaCyprusCzech RepublicDenmarkDjiboutiDominicaDominican RepublicEarly-demographic dividendEast Asia & PacificEast Asia & Pacific (excluding high income)East Asia & Pacific (IDA & IBRD countries)EcuadorEgypt, Arab Rep.El SalvadorEquatorial GuineaEritreaEstoniaEthiopiaEuro areaEurope & Central AsiaEurope & Central Asia (excluding high income)Europe & Central Asia (IDA & IBRD countries)European UnionFaroe IslandsFijiFinlandFragile and conflict affected situationsFranceFrench PolynesiaGabonGambia, TheGeorgiaGermanyGhanaGreeceGreenlandGrenadaGuatemalaGuineaGuinea-BissauGuyanaHaitiHeavily indebted poor countries (HIPC)High incomeHondurasHong Kong SAR, ChinaHungaryIBRD onlyIcelandIDA & IBRD totalIDA blendIDA onlyIDA totalIndiaIndonesiaIran, Islamic Rep.IraqIrelandIsraelItalyJamaicaJapanJordanKazakhstanKenyaKiribatiKorea, Rep.KuwaitKyrgyz RepublicLao PDRLate-demographic dividendLatin America & Caribbean Latin America & Caribbean (excluding high income)Latin America & the Caribbean (IDA & IBRD countries)LatviaLeast developed countries: UN classificationLebanonLesothoLiberiaLibyaLithuaniaLow & middle incomeLow incomeLower middle incomeLuxembourgMacao SAR, ChinaMacedonia, FYRMadagascarMalawiMalaysiaMaldivesMaliMaltaMauritaniaMauritiusMexicoMiddle East & North AfricaMiddle East & North Africa (excluding high income)Middle East & North Africa (IDA & IBRD countries)Middle incomeMoldovaMongoliaMoroccoMozambiqueMyanmarNamibiaNepalNetherlandsNew CaledoniaNew ZealandNicaraguaNigerNigeriaNorth AmericaNorwayOECD membersOmanOther small statesPacific island small statesPakistanPalauPanamaPapua New GuineaParaguayPeruPhilippinesPolandPortugalPost-demographic dividendPre-demographic dividendQatarRomaniaRussian FederationRwandaSamoaSao Tome and PrincipeSaudi ArabiaSenegalSerbiaSeychellesSierra LeoneSingaporeSlovak RepublicSloveniaSmall statesSolomon IslandsSomaliaSouth AfricaSouth AsiaSouth Asia (IDA & IBRD)SpainSri LankaSt. Kitts and NevisSt. LuciaSt. Vincent and the GrenadinesSub-Saharan Africa Sub-Saharan Africa (excluding high income)Sub-Saharan Africa (IDA & IBRD countries)SudanSurinameSwazilandSwedenSwitzerlandSyrian Arab RepublicTajikistanTanzaniaThailandTimor-LesteTogoTongaTrinidad and TobagoTunisiaTurkeyTurkmenistanTurks and Caicos IslandsTuvaluUgandaUkraineUnited Arab EmiratesUnited KingdomUnited StatesUpper middle incomeUruguayVanuatuVenezuela, RBVietnamVirgin Islands (U.S.)WorldYemen, Rep.ZambiaZimbabwe Timeline:
This timeline shows a graph from 1966 to 2016 of Nicaragua. No data until 1965. Number of actual observations by date: 50.
Source name:
World Development Indicators
Source organization:
World Bank staff estimates from the Comtrade database maintained by the United Nations Statistics Division.
Categories, topics:
Energy & Mining, Private Sector, Trade
Last updated:
apr 23, 2017
Indicators value changes by year
Maximum:
31.816
jan 1, 1986
At the date of observation
Value
Absolute change
Change from previous value
jan 1, 1966
4.747
+4.747
0.0%
jan 1, 1967
4.268
-0.479
-10.1%
jan 1, 1968
4.73
+0.463
10.84%
jan 1, 1969
5.471
+0.741
15.66%
jan 1, 1970
5.965
+0.494
9.03%
jan 1, 1971
6.095
+0.13
2.17%
jan 1, 1972
7.473
+1.378
22.61%
jan 1, 1973
7.318
-0.155
-2.07%
jan 1, 1974
7.253
-0.065
-0.89%
jan 1, 1975
10.834
+3.581
49.37%
jan 1, 1976
14.284
+3.45
31.84%
jan 1, 1977
13.036
-1.247
-8.73%
jan 1, 1978
13.79
+0.754
5.78%
jan 1, 1979
15.184
+1.394
10.11%
jan 1, 1980
21.291
+6.106
40.21%
jan 1, 1981
19.939
-1.351
-6.35%
jan 1, 1982
20.029
+0.09
0.45%
jan 1, 1983
23.174
+3.145
15.7%
jan 1, 1984
18.469
-4.705
-20.3%
jan 1, 1985
17.674
-0.795
-4.3%
jan 1, 1986
31.816
+14.142
80.01%
jan 1, 1987
17.877
-13.939
-43.81%
jan 1, 1989
12.147
-5.73
-32.05%
jan 1, 1990
13.596
+1.449
11.93%
jan 1, 1991
19.018
+5.422
39.88%
jan 1, 1992
4.533
-14.485
-76.16%
jan 1, 1993
14.927
+10.393
229.27%
jan 1, 1994
13.938
-0.988
-6.62%
jan 1, 1995
12.808
-1.131
-8.11%
jan 1, 1996
17.933
+5.125
40.02%
jan 1, 1997
9.033
-8.9
-49.63%
jan 1, 1998
12.161
+3.128
34.62%
jan 1, 1999
11.838
-0.323
-2.65%
jan 1, 2000
8.238
-3.6
-30.41%
jan 1, 2001
17.831
+9.593
116.45%
jan 1, 2002
17.36
-0.471
-2.64%
jan 1, 2003
13.096
-4.264
-24.56%
jan 1, 2004
18.328
+5.231
39.94%
jan 1, 2005
19.906
+1.579
8.61%
jan 1, 2006
18.173
-1.733
-8.7%
jan 1, 2007
25.22
+7.046
38.77%
jan 1, 2008
22.542
-2.678
-10.62%
jan 1, 2009
19.204
-3.338
-14.81%
jan 1, 2010
22.235
+3.031
15.78%
jan 1, 2011
21.712
-0.523
-2.35%
jan 1, 2012
22.087
+0.374
1.72%
jan 1, 2013
24.402
+2.315
10.48%
jan 1, 2014
18.841
-5.561
-22.79%
jan 1, 2015
17.59
-1.251
-6.64%
jan 1, 2016
12.685
-4.904
-27.88%
Ranking of countries by current statistics by years


Comments: