29
/
en
AIzaSyAYiBZKx7MnpbEhh9jyipgxe19OcubqV5w
April 1, 2024
87280
Bolivia
BOL
true
2
1
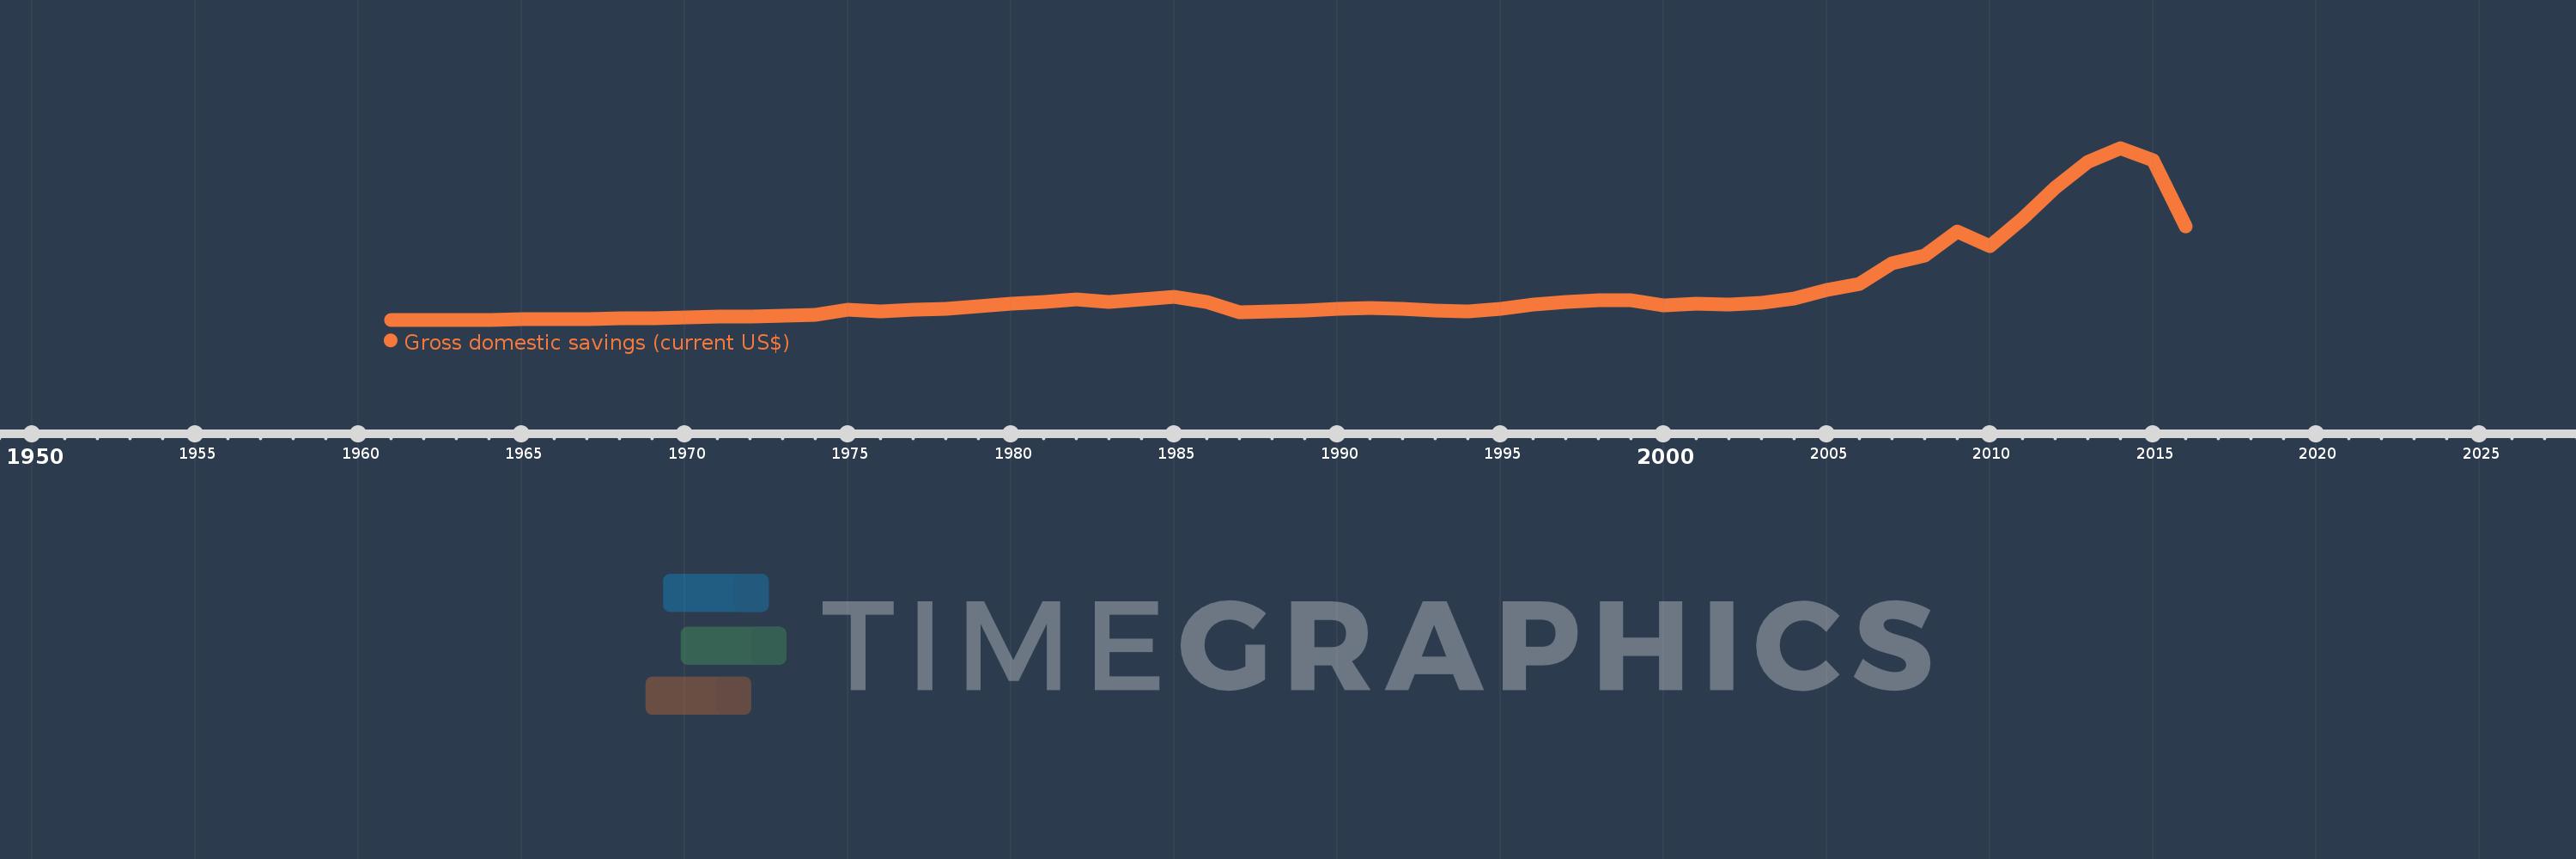
Gross domestic savings (current US$)
2016,2015,2014,2013,2012,2011,2010,2009,2008,2007,2006,2005,2004,2003,2002,2001,2000,1999,1998,1997,1996,1995,1994,1993,1992,1991,1990,1989,1988,1987,1986,1985,1984,1983,1982,1981,1980,1979,1978,1977,1976,1975,1974,1973,1972,1971,1970,1969,1968,1967,1966,1965,1964,1963,1962,1961
This statistics in other country:
AfghanistanAlbaniaAlgeriaAngolaAntigua and BarbudaArab WorldArgentinaArmeniaArubaAustraliaAustriaAzerbaijanBahamas, TheBahrainBangladeshBarbadosBelarusBelgiumBelizeBeninBermudaBhutanBoliviaBosnia and HerzegovinaBotswanaBrazilBrunei DarussalamBulgariaBurkina FasoBurundiCabo VerdeCambodiaCameroonCanadaCaribbean small statesCentral African RepublicCentral Europe and the BalticsChadChileChinaColombiaComorosCongo, Dem. Rep.Congo, Rep.Costa RicaCote d'IvoireCroatiaCubaCyprusCzech RepublicDenmarkDjiboutiDominicaDominican RepublicEarly-demographic dividendEast Asia & PacificEast Asia & Pacific (excluding high income)East Asia & Pacific (IDA & IBRD countries)EcuadorEgypt, Arab Rep.El SalvadorEquatorial GuineaEritreaEstoniaEthiopiaEuro areaEurope & Central AsiaEurope & Central Asia (excluding high income)Europe & Central Asia (IDA & IBRD countries)European UnionFaroe IslandsFijiFinlandFragile and conflict affected situationsFranceGabonGambia, TheGeorgiaGermanyGhanaGreeceGrenadaGuatemalaGuineaGuinea-BissauGuyanaHaitiHeavily indebted poor countries (HIPC)High incomeHondurasHong Kong SAR, ChinaHungaryIBRD onlyIcelandIDA & IBRD totalIDA blendIDA onlyIDA totalIndiaIndonesiaIran, Islamic Rep.IraqIrelandIsraelItalyJamaicaJapanJordanKazakhstanKenyaKiribatiKorea, Rep.KosovoKuwaitKyrgyz RepublicLao PDRLate-demographic dividendLatin America & Caribbean Latin America & Caribbean (excluding high income)Latin America & the Caribbean (IDA & IBRD countries)LatviaLeast developed countries: UN classificationLebanonLesothoLiberiaLibyaLithuaniaLow & middle incomeLow incomeLower middle incomeLuxembourgMacao SAR, ChinaMacedonia, FYRMadagascarMalawiMalaysiaMaldivesMaliMaltaMauritaniaMauritiusMexicoMicronesia, Fed. Sts.Middle East & North AfricaMiddle East & North Africa (excluding high income)Middle East & North Africa (IDA & IBRD countries)Middle incomeMoldovaMongoliaMontenegroMoroccoMozambiqueNamibiaNepalNetherlandsNew CaledoniaNew ZealandNicaraguaNigerNigeriaNorth AmericaNorwayOECD membersOmanOther small statesPakistanPanamaPapua New GuineaParaguayPeruPhilippinesPolandPortugalPost-demographic dividendPre-demographic dividendPuerto RicoQatarRomaniaRussian FederationRwandaSaudi ArabiaSenegalSerbiaSeychellesSierra LeoneSingaporeSlovak RepublicSloveniaSmall statesSolomon IslandsSouth AfricaSouth AsiaSouth Asia (IDA & IBRD)South SudanSpainSri LankaSt. Kitts and NevisSt. LuciaSt. Vincent and the GrenadinesSub-Saharan Africa Sub-Saharan Africa (excluding high income)Sub-Saharan Africa (IDA & IBRD countries)SudanSurinameSwazilandSwedenSwitzerlandSyrian Arab RepublicTajikistanTanzaniaThailandTimor-LesteTogoTongaTrinidad and TobagoTunisiaTurkeyTurkmenistanUgandaUkraineUnited Arab EmiratesUnited KingdomUnited StatesUpper middle incomeUruguayUzbekistanVanuatuVenezuela, RBVietnamWest Bank and GazaWorldYemen, Rep.ZambiaZimbabwe Timeline:
This timeline shows a graph from 1961 to 2016 of Bolivia. No data until 1960. Number of actual observations by date: 56.
Source name:
World Development Indicators
Source organization:
World Bank national accounts data, and OECD National Accounts data files.
Categories, topics:
Economy & Growth
Last updated:
apr 23, 2017
Indicators value changes by year
Minimum:
16.695 mln
jan 1, 1961
Maximum:
7.963 bln
jan 1, 2014
At the date of observation
Value
Absolute change
Change from previous value
jan 1, 1961
16.695 mln
+16.695 mln
0.0%
jan 1, 1962
16.695 mln
0.0
0.0%
jan 1, 1963
16.695 mln
0.0
0.0%
jan 1, 1964
16.695 mln
0.0
0.0%
jan 1, 1965
58.432 mln
+41.737 mln
250.0%
jan 1, 1966
58.923 mln
+490.866K
0.84%
jan 1, 1967
58.923 mln
0.0
0.0%
jan 1, 1968
75.758 mln
+16.835 mln
28.57%
jan 1, 1969
101.01 mln
+25.253 mln
33.33%
jan 1, 1970
126.263 mln
+25.253 mln
25.0%
jan 1, 1971
169.108 mln
+42.845 mln
33.93%
jan 1, 1972
151.431 mln
-17.677 mln
-10.45%
jan 1, 1973
216.698 mln
+65.267 mln
43.1%
jan 1, 1974
250.225 mln
+33.527 mln
15.47%
jan 1, 1975
484.658 mln
+234.433 mln
93.69%
jan 1, 1976
402.649 mln
-82.009 mln
-16.92%
jan 1, 1977
463.768 mln
+61.119 mln
15.18%
jan 1, 1978
525.587 mln
+61.819 mln
13.33%
jan 1, 1979
645.727 mln
+120.14 mln
22.86%
jan 1, 1980
778.6 mln
+132.872 mln
20.58%
jan 1, 1981
856.661 mln
+78.062 mln
10.03%
jan 1, 1982
964.063 mln
+107.401 mln
12.54%
jan 1, 1983
855.03 mln
-109.033 mln
-11.31%
jan 1, 1984
949.831 mln
+94.801 mln
11.09%
jan 1, 1985
1.08 bln
+130.236 mln
13.71%
jan 1, 1986
842.694 mln
-237.372 mln
-21.98%
jan 1, 1987
363.296 mln
-479.398 mln
-56.89%
jan 1, 1988
397.679 mln
+34.382 mln
9.46%
jan 1, 1989
441.804 mln
+44.125 mln
11.1%
jan 1, 1990
515.424 mln
+73.62 mln
16.66%
jan 1, 1991
554.059 mln
+38.635 mln
7.5%
jan 1, 1992
539.216 mln
-14.842 mln
-2.68%
jan 1, 1993
433.733 mln
-105.483 mln
-19.56%
jan 1, 1994
416.233 mln
-17.5 mln
-4.03%
jan 1, 1995
528.561 mln
+112.328 mln
26.99%
jan 1, 1996
712.408 mln
+183.848 mln
34.78%
jan 1, 1997
853.955 mln
+141.547 mln
19.87%
jan 1, 1998
902.22 mln
+48.265 mln
5.65%
jan 1, 1999
911.168 mln
+8.948 mln
0.99%
jan 1, 2000
693.079 mln
-218.089 mln
-23.94%
jan 1, 2001
763.807 mln
+70.727 mln
10.2%
jan 1, 2002
731.51 mln
-32.297 mln
-4.23%
jan 1, 2003
807.413 mln
+75.903 mln
10.38%
jan 1, 2004
1.008 bln
+200.111 mln
24.78%
jan 1, 2005
1.389 bln
+381.684 mln
37.88%
jan 1, 2006
1.691 bln
+301.74 mln
21.72%
jan 1, 2007
2.619 bln
+928.199 mln
54.89%
jan 1, 2008
2.98 bln
+361.162 mln
13.79%
jan 1, 2009
4.085 bln
+1.105 bln
37.06%
jan 1, 2010
3.431 bln
-653.456 mln
-16.0%
jan 1, 2011
4.69 bln
+1.259 bln
36.68%
jan 1, 2012
6.115 bln
+1.425 bln
30.38%
jan 1, 2013
7.328 bln
+1.213 bln
19.84%
jan 1, 2014
7.963 bln
+634.732 mln
8.66%
jan 1, 2015
7.377 bln
-586.252 mln
-7.36%
jan 1, 2016
4.347 bln
-3.029 bln
-41.06%
Ranking of countries by current statistics by years


Comments: