29
/
en
AIzaSyAYiBZKx7MnpbEhh9jyipgxe19OcubqV5w
April 1, 2024
112299
Costa Rica
CRI
true
2
1
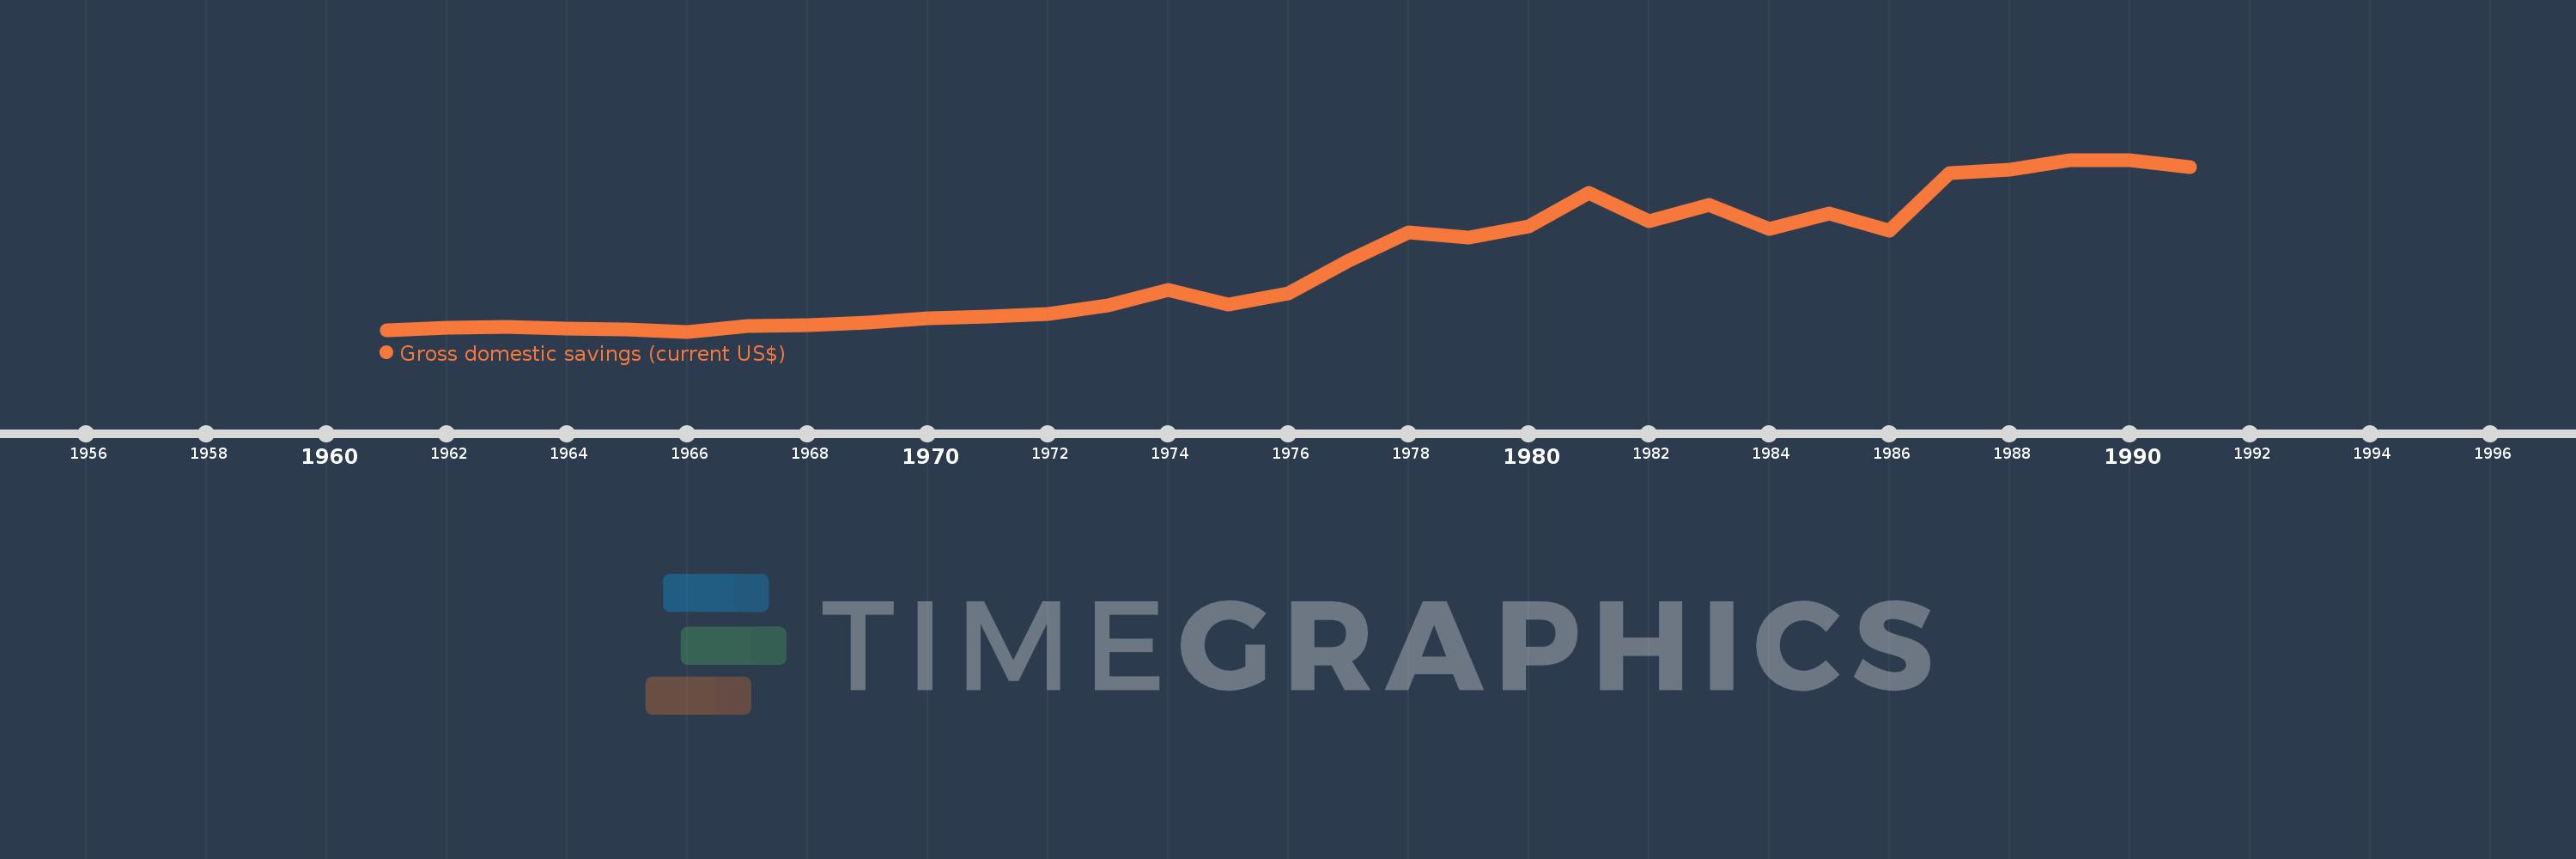
Gross domestic savings (current US$)
1991,1990,1989,1988,1987,1986,1985,1984,1983,1982,1981,1980,1979,1978,1977,1976,1975,1974,1973,1972,1971,1970,1969,1968,1967,1966,1965,1964,1963,1962,1961
This statistics in other country:
AfghanistanAlbaniaAlgeriaAngolaAntigua and BarbudaArab WorldArgentinaArmeniaArubaAustraliaAustriaAzerbaijanBahamas, TheBahrainBangladeshBarbadosBelarusBelgiumBelizeBeninBermudaBhutanBoliviaBosnia and HerzegovinaBotswanaBrazilBrunei DarussalamBulgariaBurkina FasoBurundiCabo VerdeCambodiaCameroonCanadaCaribbean small statesCentral African RepublicCentral Europe and the BalticsChadChileChinaColombiaComorosCongo, Dem. Rep.Congo, Rep.Costa RicaCote d'IvoireCroatiaCubaCyprusCzech RepublicDenmarkDjiboutiDominicaDominican RepublicEarly-demographic dividendEast Asia & PacificEast Asia & Pacific (excluding high income)East Asia & Pacific (IDA & IBRD countries)EcuadorEgypt, Arab Rep.El SalvadorEquatorial GuineaEritreaEstoniaEthiopiaEuro areaEurope & Central AsiaEurope & Central Asia (excluding high income)Europe & Central Asia (IDA & IBRD countries)European UnionFaroe IslandsFijiFinlandFragile and conflict affected situationsFranceGabonGambia, TheGeorgiaGermanyGhanaGreeceGrenadaGuatemalaGuineaGuinea-BissauGuyanaHaitiHeavily indebted poor countries (HIPC)High incomeHondurasHong Kong SAR, ChinaHungaryIBRD onlyIcelandIDA & IBRD totalIDA blendIDA onlyIDA totalIndiaIndonesiaIran, Islamic Rep.IraqIrelandIsraelItalyJamaicaJapanJordanKazakhstanKenyaKiribatiKorea, Rep.KosovoKuwaitKyrgyz RepublicLao PDRLate-demographic dividendLatin America & Caribbean Latin America & Caribbean (excluding high income)Latin America & the Caribbean (IDA & IBRD countries)LatviaLeast developed countries: UN classificationLebanonLesothoLiberiaLibyaLithuaniaLow & middle incomeLow incomeLower middle incomeLuxembourgMacao SAR, ChinaMacedonia, FYRMadagascarMalawiMalaysiaMaldivesMaliMaltaMauritaniaMauritiusMexicoMicronesia, Fed. Sts.Middle East & North AfricaMiddle East & North Africa (excluding high income)Middle East & North Africa (IDA & IBRD countries)Middle incomeMoldovaMongoliaMontenegroMoroccoMozambiqueNamibiaNepalNetherlandsNew CaledoniaNew ZealandNicaraguaNigerNigeriaNorth AmericaNorwayOECD membersOmanOther small statesPakistanPanamaPapua New GuineaParaguayPeruPhilippinesPolandPortugalPost-demographic dividendPre-demographic dividendPuerto RicoQatarRomaniaRussian FederationRwandaSaudi ArabiaSenegalSerbiaSeychellesSierra LeoneSingaporeSlovak RepublicSloveniaSmall statesSolomon IslandsSouth AfricaSouth AsiaSouth Asia (IDA & IBRD)South SudanSpainSri LankaSt. Kitts and NevisSt. LuciaSt. Vincent and the GrenadinesSub-Saharan Africa Sub-Saharan Africa (excluding high income)Sub-Saharan Africa (IDA & IBRD countries)SudanSurinameSwazilandSwedenSwitzerlandSyrian Arab RepublicTajikistanTanzaniaThailandTimor-LesteTogoTongaTrinidad and TobagoTunisiaTurkeyTurkmenistanUgandaUkraineUnited Arab EmiratesUnited KingdomUnited StatesUpper middle incomeUruguayUzbekistanVanuatuVenezuela, RBVietnamWest Bank and GazaWorldYemen, Rep.ZambiaZimbabwe Timeline:
This timeline shows a graph from 1961 to 1991 of Costa Rica. No data until 1960. Number of actual observations by date: 31.
Source name:
World Development Indicators
Source organization:
World Bank national accounts data, and OECD National Accounts data files.
Categories, topics:
Economy & Growth
Last updated:
apr 23, 2017
Indicators value changes by year
Minimum:
56.272 mln
jan 1, 1966
Maximum:
955.943 mln
jan 1, 1990
At the date of observation
Value
Absolute change
Change from previous value
jan 1, 1961
64.652 mln
+64.652 mln
0.0%
jan 1, 1962
74.822 mln
+10.169 mln
15.73%
jan 1, 1963
80.014 mln
+5.192 mln
6.94%
jan 1, 1964
72.886 mln
-7.128 mln
-8.91%
jan 1, 1965
67.833 mln
-5.053 mln
-6.93%
jan 1, 1966
56.272 mln
-11.562 mln
-17.04%
jan 1, 1967
86.4 mln
+30.128 mln
53.54%
jan 1, 1968
92.151 mln
+5.751 mln
6.66%
jan 1, 1969
104.589 mln
+12.438 mln
13.5%
jan 1, 1970
126.657 mln
+22.068 mln
21.1%
jan 1, 1971
135.577 mln
+8.921 mln
7.04%
jan 1, 1972
150.246 mln
+14.669 mln
10.82%
jan 1, 1973
193.052 mln
+42.806 mln
28.49%
jan 1, 1974
273.56 mln
+80.508 mln
41.7%
jan 1, 1975
198.789 mln
-74.771 mln
-27.33%
jan 1, 1976
257.958 mln
+59.169 mln
29.76%
jan 1, 1977
426.068 mln
+168.11 mln
65.17%
jan 1, 1978
577.736 mln
+151.669 mln
35.6%
jan 1, 1979
550.012 mln
-27.725 mln
-4.8%
jan 1, 1980
607.083 mln
+57.071 mln
10.38%
jan 1, 1981
784.317 mln
+177.235 mln
29.19%
jan 1, 1982
632.831 mln
-151.486 mln
-19.31%
jan 1, 1983
719.561 mln
+86.73 mln
13.7%
jan 1, 1984
594.405 mln
-125.155 mln
-17.39%
jan 1, 1985
674.128 mln
+79.723 mln
13.41%
jan 1, 1986
582.852 mln
-91.277 mln
-13.54%
jan 1, 1987
884.266 mln
+301.414 mln
51.71%
jan 1, 1988
904.281 mln
+20.015 mln
2.26%
jan 1, 1989
951.843 mln
+47.562 mln
5.26%
jan 1, 1990
955.943 mln
+4.099 mln
0.43%
jan 1, 1991
919.152 mln
-36.791 mln
-3.85%
Ranking of countries by current statistics by years


Comments: