29
/
en
AIzaSyAYiBZKx7MnpbEhh9jyipgxe19OcubqV5w
April 1, 2024
144423
Guatemala
GTM
true
2
1
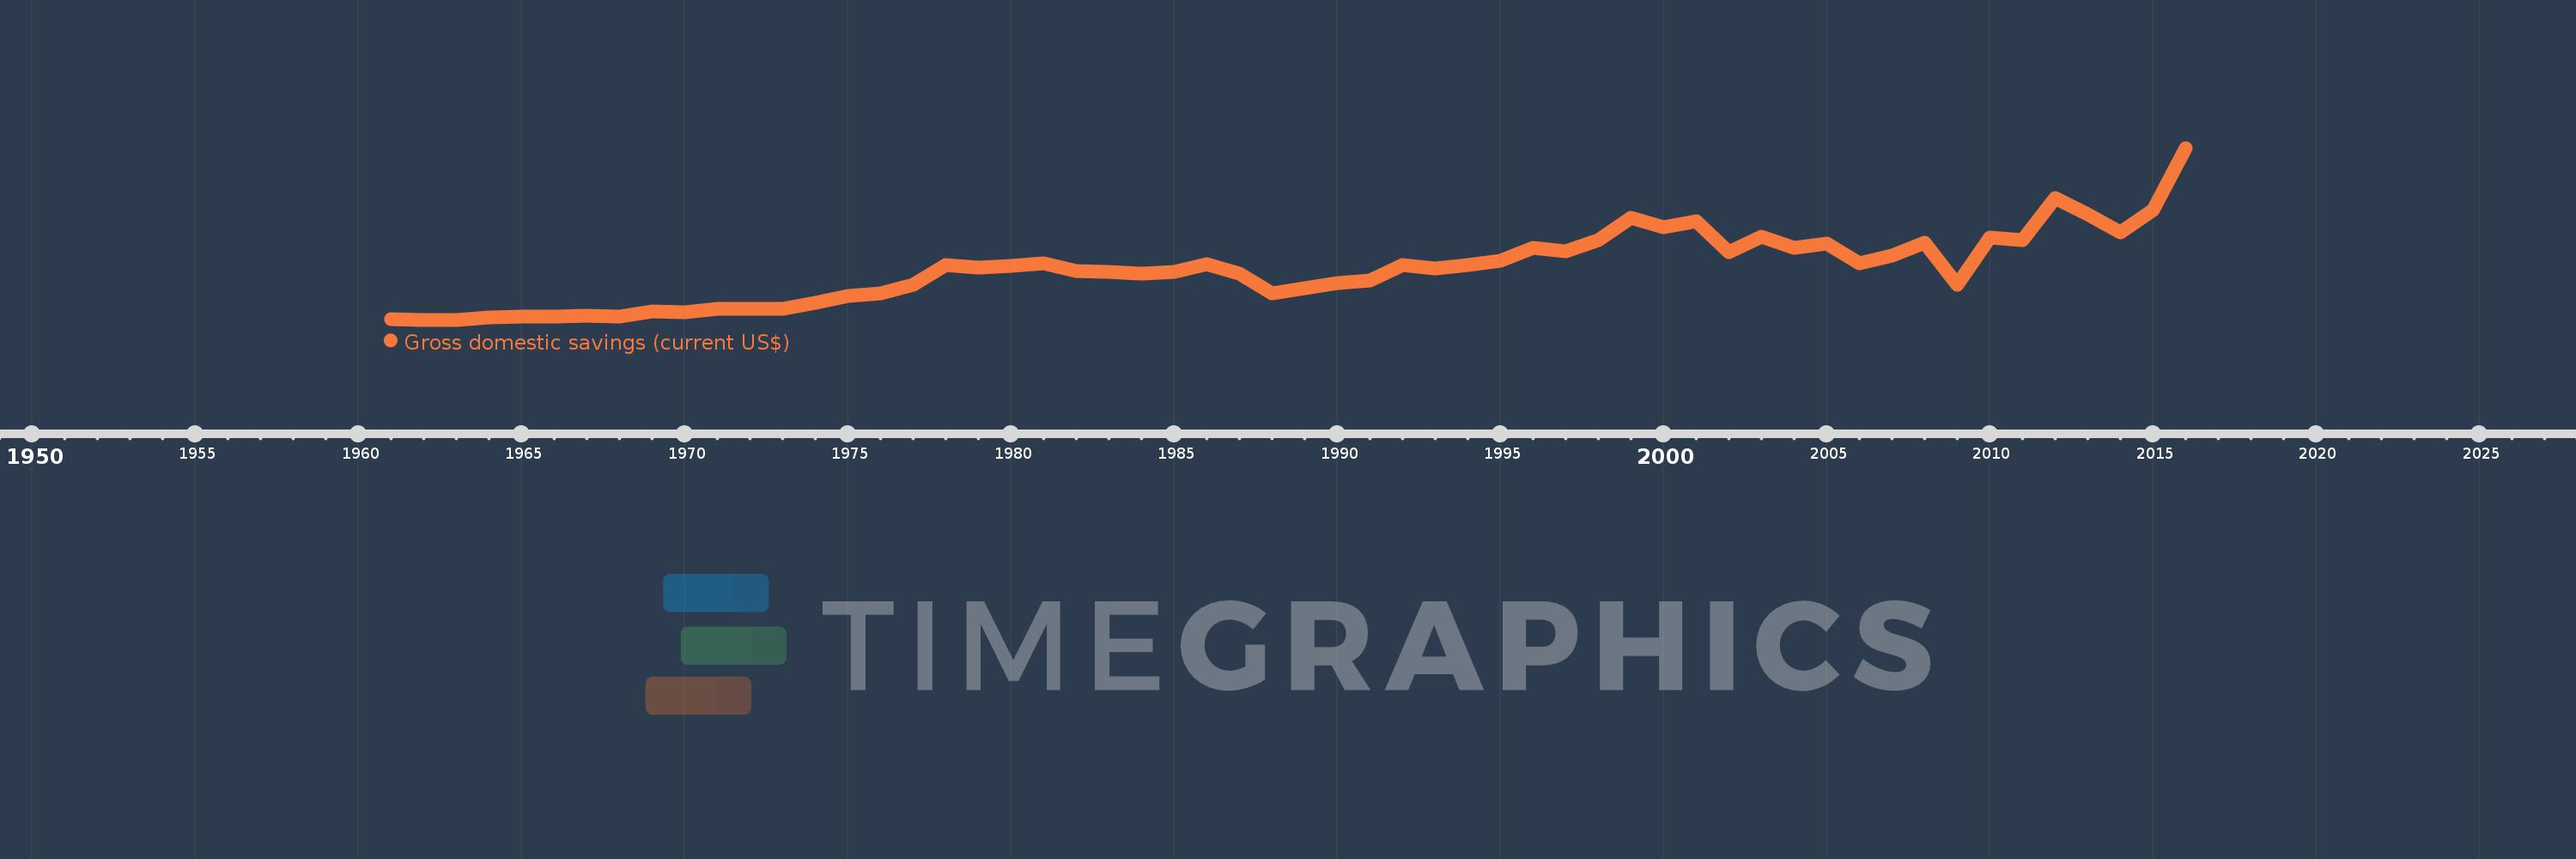
Gross domestic savings (current US$)
2016,2015,2014,2013,2012,2011,2010,2009,2008,2007,2006,2005,2004,2003,2002,2001,2000,1999,1998,1997,1996,1995,1994,1993,1992,1991,1990,1989,1988,1987,1986,1985,1984,1983,1982,1981,1980,1979,1978,1977,1976,1975,1974,1973,1972,1971,1970,1969,1968,1967,1966,1965,1964,1963,1962,1961
This statistics in other country:
AfghanistanAlbaniaAlgeriaAngolaAntigua and BarbudaArab WorldArgentinaArmeniaArubaAustraliaAustriaAzerbaijanBahamas, TheBahrainBangladeshBarbadosBelarusBelgiumBelizeBeninBermudaBhutanBoliviaBosnia and HerzegovinaBotswanaBrazilBrunei DarussalamBulgariaBurkina FasoBurundiCabo VerdeCambodiaCameroonCanadaCaribbean small statesCentral African RepublicCentral Europe and the BalticsChadChileChinaColombiaComorosCongo, Dem. Rep.Congo, Rep.Costa RicaCote d'IvoireCroatiaCubaCyprusCzech RepublicDenmarkDjiboutiDominicaDominican RepublicEarly-demographic dividendEast Asia & PacificEast Asia & Pacific (excluding high income)East Asia & Pacific (IDA & IBRD countries)EcuadorEgypt, Arab Rep.El SalvadorEquatorial GuineaEritreaEstoniaEthiopiaEuro areaEurope & Central AsiaEurope & Central Asia (excluding high income)Europe & Central Asia (IDA & IBRD countries)European UnionFaroe IslandsFijiFinlandFragile and conflict affected situationsFranceGabonGambia, TheGeorgiaGermanyGhanaGreeceGrenadaGuatemalaGuineaGuinea-BissauGuyanaHaitiHeavily indebted poor countries (HIPC)High incomeHondurasHong Kong SAR, ChinaHungaryIBRD onlyIcelandIDA & IBRD totalIDA blendIDA onlyIDA totalIndiaIndonesiaIran, Islamic Rep.IraqIrelandIsraelItalyJamaicaJapanJordanKazakhstanKenyaKiribatiKorea, Rep.KosovoKuwaitKyrgyz RepublicLao PDRLate-demographic dividendLatin America & Caribbean Latin America & Caribbean (excluding high income)Latin America & the Caribbean (IDA & IBRD countries)LatviaLeast developed countries: UN classificationLebanonLesothoLiberiaLibyaLithuaniaLow & middle incomeLow incomeLower middle incomeLuxembourgMacao SAR, ChinaMacedonia, FYRMadagascarMalawiMalaysiaMaldivesMaliMaltaMauritaniaMauritiusMexicoMicronesia, Fed. Sts.Middle East & North AfricaMiddle East & North Africa (excluding high income)Middle East & North Africa (IDA & IBRD countries)Middle incomeMoldovaMongoliaMontenegroMoroccoMozambiqueNamibiaNepalNetherlandsNew CaledoniaNew ZealandNicaraguaNigerNigeriaNorth AmericaNorwayOECD membersOmanOther small statesPakistanPanamaPapua New GuineaParaguayPeruPhilippinesPolandPortugalPost-demographic dividendPre-demographic dividendPuerto RicoQatarRomaniaRussian FederationRwandaSaudi ArabiaSenegalSerbiaSeychellesSierra LeoneSingaporeSlovak RepublicSloveniaSmall statesSolomon IslandsSouth AfricaSouth AsiaSouth Asia (IDA & IBRD)South SudanSpainSri LankaSt. Kitts and NevisSt. LuciaSt. Vincent and the GrenadinesSub-Saharan Africa Sub-Saharan Africa (excluding high income)Sub-Saharan Africa (IDA & IBRD countries)SudanSurinameSwazilandSwedenSwitzerlandSyrian Arab RepublicTajikistanTanzaniaThailandTimor-LesteTogoTongaTrinidad and TobagoTunisiaTurkeyTurkmenistanUgandaUkraineUnited Arab EmiratesUnited KingdomUnited StatesUpper middle incomeUruguayUzbekistanVanuatuVenezuela, RBVietnamWest Bank and GazaWorldYemen, Rep.ZambiaZimbabwe Timeline:
This timeline shows a graph from 1961 to 2016 of Guatemala. No data until 1960. Number of actual observations by date: 56.
Source name:
World Development Indicators
Source organization:
World Bank national accounts data, and OECD National Accounts data files.
Categories, topics:
Economy & Growth
Last updated:
apr 23, 2017
Indicators value changes by year
Minimum:
79.4 mln
jan 1, 1962
Maximum:
2.985 bln
jan 1, 2016
At the date of observation
Value
Absolute change
Change from previous value
jan 1, 1961
87.7 mln
+87.7 mln
0.0%
jan 1, 1962
79.4 mln
-8.3 mln
-9.46%
jan 1, 1963
81.7 mln
+2.3 mln
2.9%
jan 1, 1964
112.5 mln
+30.8 mln
37.7%
jan 1, 1965
131.4 mln
+18.9 mln
16.8%
jan 1, 1966
139.6 mln
+8.2 mln
6.24%
jan 1, 1967
146.9 mln
+7.3 mln
5.23%
jan 1, 1968
140.1 mln
-6.8 mln
-4.63%
jan 1, 1969
216.8 mln
+76.7 mln
54.75%
jan 1, 1970
202.1 mln
-14.7 mln
-6.78%
jan 1, 1971
259.3 mln
+57.2 mln
28.3%
jan 1, 1972
257.5 mln
-1.8 mln
-0.69%
jan 1, 1973
262.6 mln
+5.1 mln
1.98%
jan 1, 1974
369.0 mln
+106.4 mln
40.52%
jan 1, 1975
485.0 mln
+116.0 mln
31.44%
jan 1, 1976
520.8 mln
+35.8 mln
7.38%
jan 1, 1977
672.0 mln
+151.2 mln
29.03%
jan 1, 1978
999.5 mln
+327.5 mln
48.74%
jan 1, 1979
961.1 mln
-38.4 mln
-3.84%
jan 1, 1980
983.1 mln
+22.0 mln
2.29%
jan 1, 1981
1.035 bln
+51.6 mln
5.25%
jan 1, 1982
905.5 mln
-129.2 mln
-12.49%
jan 1, 1983
893.0 mln
-12.5 mln
-1.38%
jan 1, 1984
861.0 mln
-32.0 mln
-3.58%
jan 1, 1985
892.4 mln
+31.4 mln
3.65%
jan 1, 1986
1.017 bln
+124.644 mln
13.97%
jan 1, 1987
852.831 mln
-164.213 mln
-16.15%
jan 1, 1988
528.88 mln
-323.951 mln
-37.99%
jan 1, 1989
616.87 mln
+87.99 mln
16.64%
jan 1, 1990
702.166 mln
+85.296 mln
13.83%
jan 1, 1991
748.807 mln
+46.641 mln
6.64%
jan 1, 1992
1.005 bln
+255.786 mln
34.16%
jan 1, 1993
949.6 mln
-54.994 mln
-5.47%
jan 1, 1994
1.012 bln
+61.965 mln
6.53%
jan 1, 1995
1.084 bln
+72.574 mln
7.17%
jan 1, 1996
1.302 bln
+217.821 mln
20.09%
jan 1, 1997
1.241 bln
-61.441 mln
-4.72%
jan 1, 1998
1.431 bln
+190.661 mln
15.37%
jan 1, 1999
1.807 bln
+375.506 mln
26.24%
jan 1, 2000
1.649 bln
-157.408 mln
-8.71%
jan 1, 2001
1.751 bln
+102.132 mln
6.19%
jan 1, 2002
1.221 bln
-530.203 mln
-30.27%
jan 1, 2003
1.479 bln
+258.082 mln
21.13%
jan 1, 2004
1.291 bln
-188.718 mln
-12.76%
jan 1, 2005
1.371 bln
+80.109 mln
6.21%
jan 1, 2006
1.033 bln
-337.573 mln
-24.63%
jan 1, 2007
1.17 bln
+136.662 mln
13.23%
jan 1, 2008
1.386 bln
+216.329 mln
18.49%
jan 1, 2009
670.567 mln
-715.53 mln
-51.62%
jan 1, 2010
1.471 bln
+800.212 mln
119.33%
jan 1, 2011
1.42 bln
-51.188 mln
-3.48%
jan 1, 2012
2.142 bln
+722.896 mln
50.92%
jan 1, 2013
1.869 bln
-273.336 mln
-12.76%
jan 1, 2014
1.562 bln
-307.646 mln
-16.46%
jan 1, 2015
1.941 bln
+379.235 mln
24.29%
jan 1, 2016
2.985 bln
+1.044 bln
53.81%
Ranking of countries by current statistics by years


Comments: