29
/
en
AIzaSyAYiBZKx7MnpbEhh9jyipgxe19OcubqV5w
April 1, 2024
123543
Ecuador
ECU
true
2
1
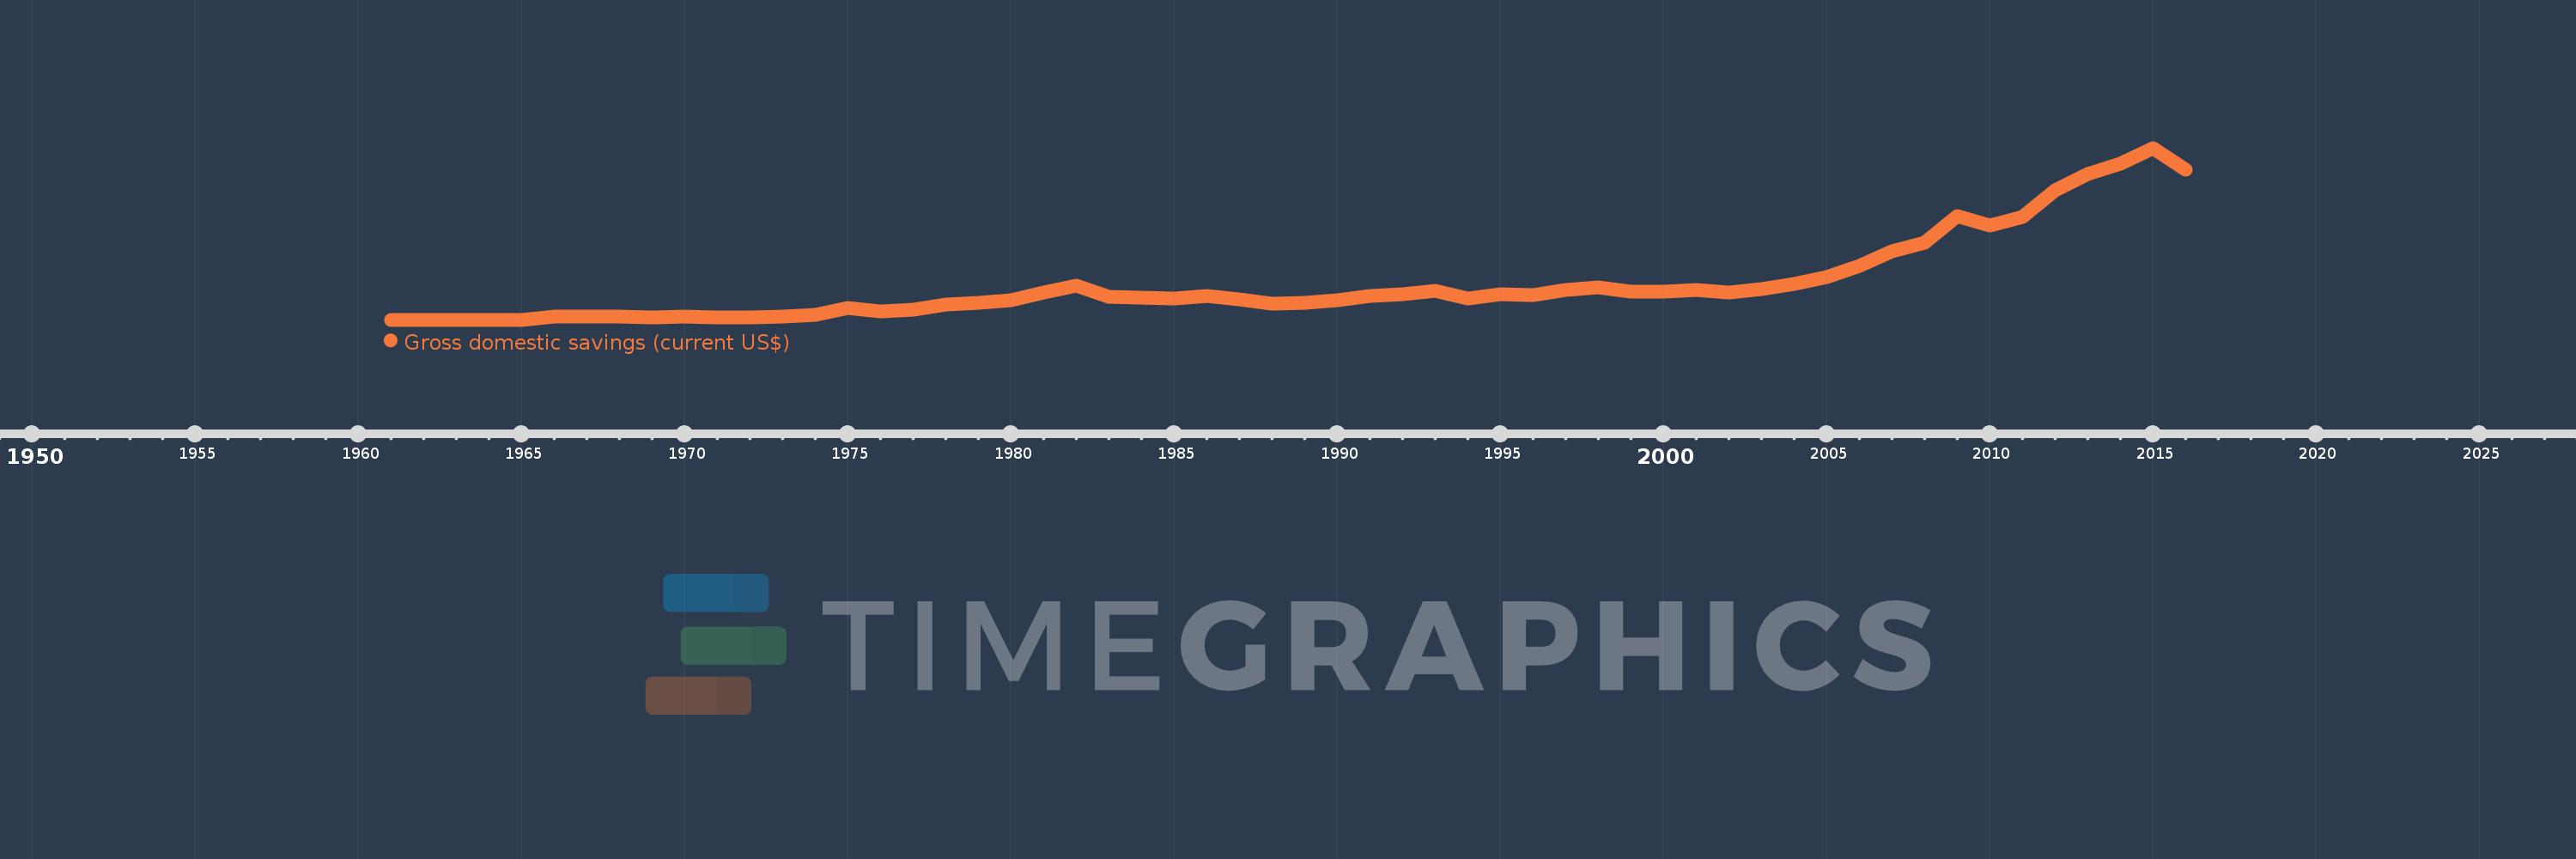
Gross domestic savings (current US$)
2016,2015,2014,2013,2012,2011,2010,2009,2008,2007,2006,2005,2004,2003,2002,2001,2000,1999,1998,1997,1996,1995,1994,1993,1992,1991,1990,1989,1988,1987,1986,1985,1984,1983,1982,1981,1980,1979,1978,1977,1976,1975,1974,1973,1972,1971,1970,1969,1968,1967,1966,1965,1964,1963,1962,1961
This statistics in other country:
AfghanistanAlbaniaAlgeriaAngolaAntigua and BarbudaArab WorldArgentinaArmeniaArubaAustraliaAustriaAzerbaijanBahamas, TheBahrainBangladeshBarbadosBelarusBelgiumBelizeBeninBermudaBhutanBoliviaBosnia and HerzegovinaBotswanaBrazilBrunei DarussalamBulgariaBurkina FasoBurundiCabo VerdeCambodiaCameroonCanadaCaribbean small statesCentral African RepublicCentral Europe and the BalticsChadChileChinaColombiaComorosCongo, Dem. Rep.Congo, Rep.Costa RicaCote d'IvoireCroatiaCubaCyprusCzech RepublicDenmarkDjiboutiDominicaDominican RepublicEarly-demographic dividendEast Asia & PacificEast Asia & Pacific (excluding high income)East Asia & Pacific (IDA & IBRD countries)EcuadorEgypt, Arab Rep.El SalvadorEquatorial GuineaEritreaEstoniaEthiopiaEuro areaEurope & Central AsiaEurope & Central Asia (excluding high income)Europe & Central Asia (IDA & IBRD countries)European UnionFaroe IslandsFijiFinlandFragile and conflict affected situationsFranceGabonGambia, TheGeorgiaGermanyGhanaGreeceGrenadaGuatemalaGuineaGuinea-BissauGuyanaHaitiHeavily indebted poor countries (HIPC)High incomeHondurasHong Kong SAR, ChinaHungaryIBRD onlyIcelandIDA & IBRD totalIDA blendIDA onlyIDA totalIndiaIndonesiaIran, Islamic Rep.IraqIrelandIsraelItalyJamaicaJapanJordanKazakhstanKenyaKiribatiKorea, Rep.KosovoKuwaitKyrgyz RepublicLao PDRLate-demographic dividendLatin America & Caribbean Latin America & Caribbean (excluding high income)Latin America & the Caribbean (IDA & IBRD countries)LatviaLeast developed countries: UN classificationLebanonLesothoLiberiaLibyaLithuaniaLow & middle incomeLow incomeLower middle incomeLuxembourgMacao SAR, ChinaMacedonia, FYRMadagascarMalawiMalaysiaMaldivesMaliMaltaMauritaniaMauritiusMexicoMicronesia, Fed. Sts.Middle East & North AfricaMiddle East & North Africa (excluding high income)Middle East & North Africa (IDA & IBRD countries)Middle incomeMoldovaMongoliaMontenegroMoroccoMozambiqueNamibiaNepalNetherlandsNew CaledoniaNew ZealandNicaraguaNigerNigeriaNorth AmericaNorwayOECD membersOmanOther small statesPakistanPanamaPapua New GuineaParaguayPeruPhilippinesPolandPortugalPost-demographic dividendPre-demographic dividendPuerto RicoQatarRomaniaRussian FederationRwandaSaudi ArabiaSenegalSerbiaSeychellesSierra LeoneSingaporeSlovak RepublicSloveniaSmall statesSolomon IslandsSouth AfricaSouth AsiaSouth Asia (IDA & IBRD)South SudanSpainSri LankaSt. Kitts and NevisSt. LuciaSt. Vincent and the GrenadinesSub-Saharan Africa Sub-Saharan Africa (excluding high income)Sub-Saharan Africa (IDA & IBRD countries)SudanSurinameSwazilandSwedenSwitzerlandSyrian Arab RepublicTajikistanTanzaniaThailandTimor-LesteTogoTongaTrinidad and TobagoTunisiaTurkeyTurkmenistanUgandaUkraineUnited Arab EmiratesUnited KingdomUnited StatesUpper middle incomeUruguayUzbekistanVanuatuVenezuela, RBVietnamWest Bank and GazaWorldYemen, Rep.ZambiaZimbabwe Timeline:
This timeline shows a graph from 1961 to 2016 of Ecuador. No data until 1960. Number of actual observations by date: 56.
Source name:
World Development Indicators
Source organization:
World Bank national accounts data, and OECD National Accounts data files.
Categories, topics:
Economy & Growth
Last updated:
apr 23, 2017
Indicators value changes by year
Minimum:
83.571 mln
jan 1, 1965
Maximum:
27.293 bln
jan 1, 2015
At the date of observation
Value
Absolute change
Change from previous value
jan 1, 1961
101.967 mln
+101.967 mln
0.0%
jan 1, 1962
86.826 mln
-15.14 mln
-14.85%
jan 1, 1963
86.114 mln
-712.386K
-0.82%
jan 1, 1964
94.461 mln
+8.347 mln
9.69%
jan 1, 1965
83.571 mln
-10.89 mln
-11.53%
jan 1, 1966
550.312 mln
+466.741 mln
558.5%
jan 1, 1967
528.466 mln
-21.845 mln
-3.97%
jan 1, 1968
535.737 mln
+7.27 mln
1.38%
jan 1, 1969
399.765 mln
-135.972 mln
-25.38%
jan 1, 1970
587.721 mln
+187.956 mln
47.02%
jan 1, 1971
457.746 mln
-129.974 mln
-22.11%
jan 1, 1972
448.639 mln
-9.107 mln
-1.99%
jan 1, 1973
640.745 mln
+192.106 mln
42.82%
jan 1, 1974
846.218 mln
+205.472 mln
32.07%
jan 1, 1975
1.884 bln
+1.037 bln
122.59%
jan 1, 1976
1.338 bln
-545.146 mln
-28.94%
jan 1, 1977
1.738 bln
+399.275 mln
29.83%
jan 1, 1978
2.498 bln
+760.072 mln
43.74%
jan 1, 1979
2.715 bln
+217.096 mln
8.69%
jan 1, 1980
3.193 bln
+477.586 mln
17.59%
jan 1, 1981
4.407 bln
+1.215 bln
38.04%
jan 1, 1982
5.485 bln
+1.078 bln
24.45%
jan 1, 1983
3.72 bln
-1.765 bln
-32.18%
jan 1, 1984
3.586 bln
-133.423 mln
-3.59%
jan 1, 1985
3.463 bln
-123.385 mln
-3.44%
jan 1, 1986
3.875 bln
+412.118 mln
11.9%
jan 1, 1987
3.326 bln
-549.407 mln
-14.18%
jan 1, 1988
2.567 bln
-758.56 mln
-22.81%
jan 1, 1989
2.801 bln
+233.65 mln
9.1%
jan 1, 1990
3.131 bln
+330.543 mln
11.8%
jan 1, 1991
3.811 bln
+679.295 mln
21.69%
jan 1, 1992
4.111 bln
+300.174 mln
7.88%
jan 1, 1993
4.728 bln
+617.322 mln
15.02%
jan 1, 1994
3.405 bln
-1.323 bln
-27.99%
jan 1, 1995
4.103 bln
+698.257 mln
20.51%
jan 1, 1996
4.028 bln
-74.716 mln
-1.82%
jan 1, 1997
4.76 bln
+731.565 mln
18.16%
jan 1, 1998
5.171 bln
+411.119 mln
8.64%
jan 1, 1999
4.585 bln
-586.326 mln
-11.34%
jan 1, 2000
4.554 bln
-30.455 mln
-0.66%
jan 1, 2001
4.778 bln
+223.657 mln
4.91%
jan 1, 2002
4.416 bln
-361.44 mln
-7.56%
jan 1, 2003
4.942 bln
+525.545 mln
11.9%
jan 1, 2004
5.69 bln
+748.268 mln
15.14%
jan 1, 2005
6.822 bln
+1.131 bln
19.88%
jan 1, 2006
8.623 bln
+1.801 bln
26.4%
jan 1, 2007
10.959 bln
+2.337 bln
27.1%
jan 1, 2008
12.232 bln
+1.273 bln
11.62%
jan 1, 2009
16.465 bln
+4.232 bln
34.6%
jan 1, 2010
15.025 bln
-1.439 bln
-8.74%
jan 1, 2011
16.362 bln
+1.337 bln
8.9%
jan 1, 2012
20.528 bln
+4.166 bln
25.46%
jan 1, 2013
23.19 bln
+2.661 bln
12.96%
jan 1, 2014
24.864 bln
+1.675 bln
7.22%
jan 1, 2015
27.293 bln
+2.428 bln
9.77%
jan 1, 2016
23.909 bln
-3.384 bln
-12.4%
Ranking of countries by current statistics by years


Comments: