29
/
en
AIzaSyAYiBZKx7MnpbEhh9jyipgxe19OcubqV5w
April 1, 2024
240504
Singapore
SGP
true
2
1
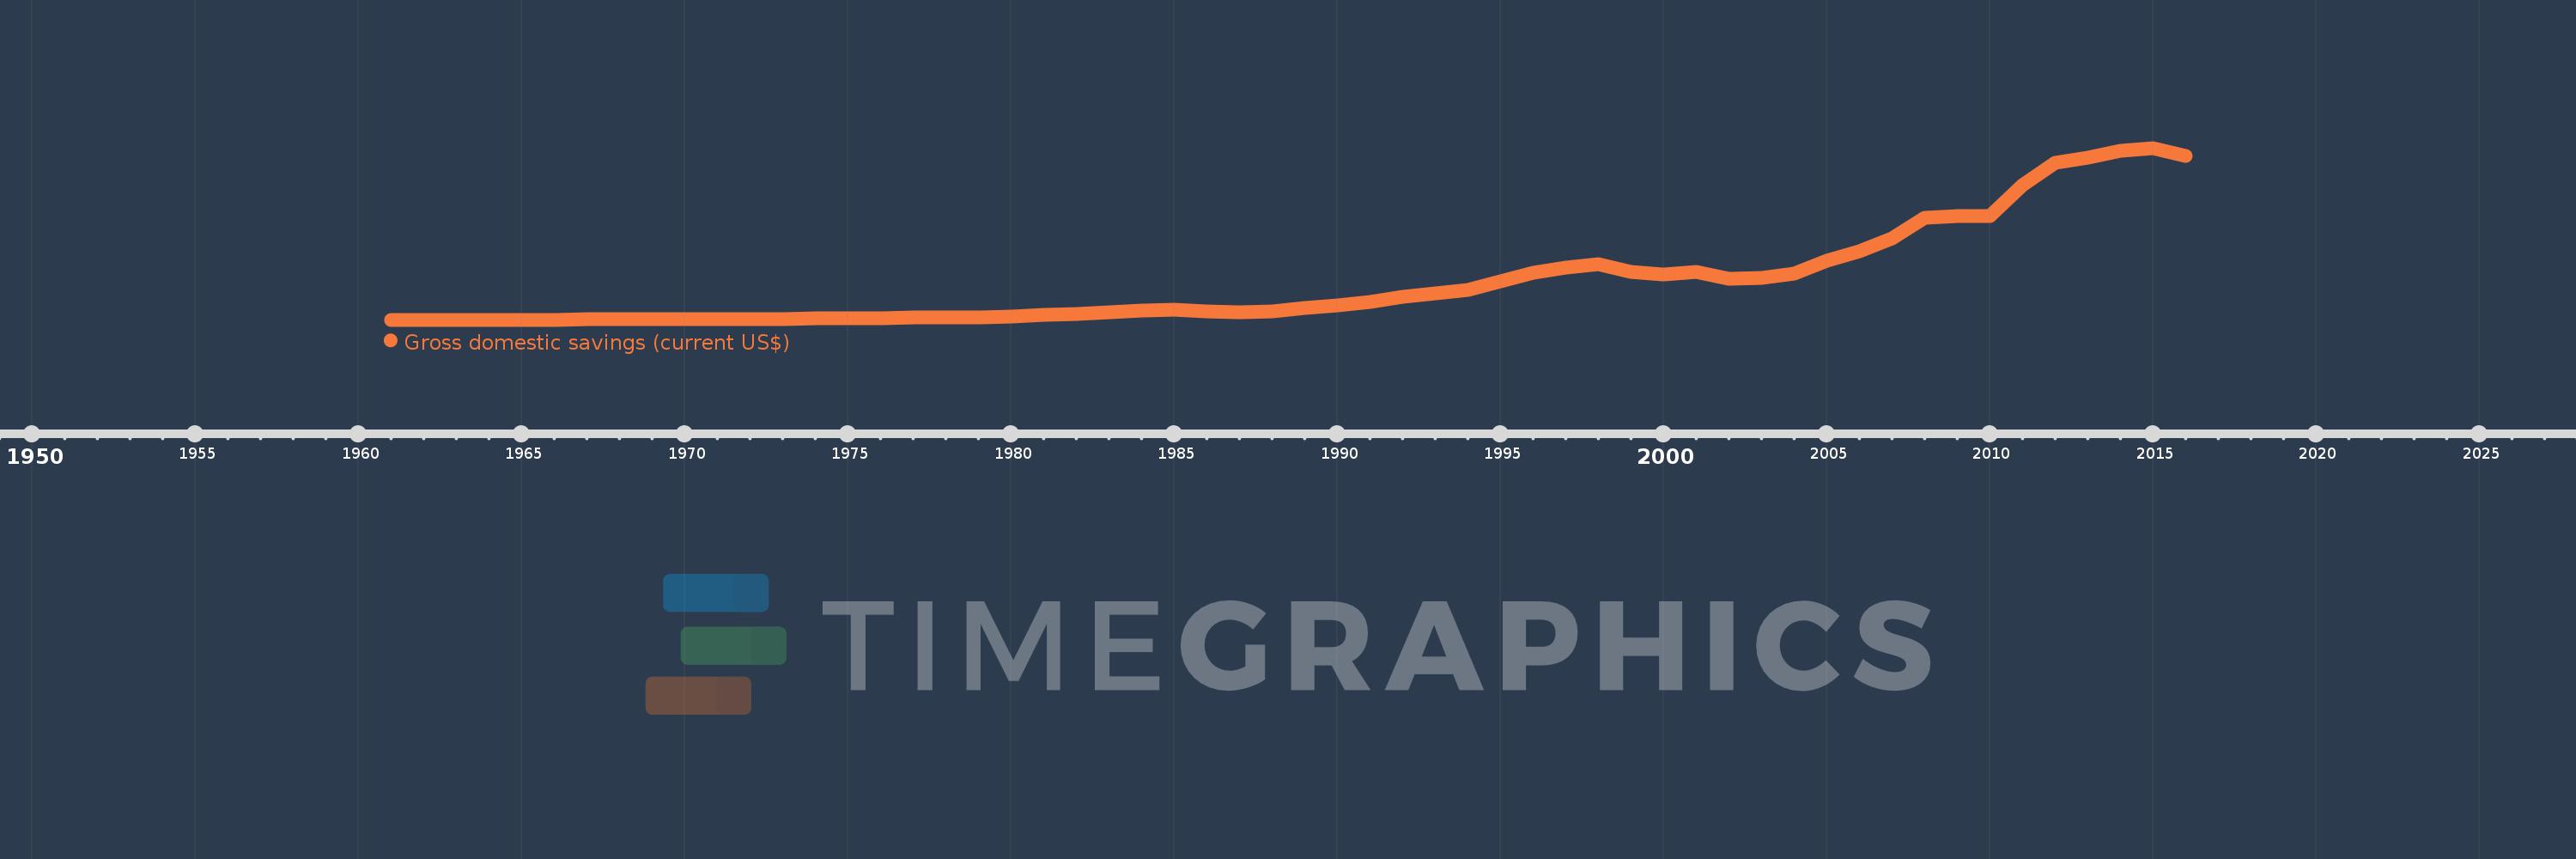
Gross domestic savings (current US$)
2016,2015,2014,2013,2012,2011,2010,2009,2008,2007,2006,2005,2004,2003,2002,2001,2000,1999,1998,1997,1996,1995,1994,1993,1992,1991,1990,1989,1988,1987,1986,1985,1984,1983,1982,1981,1980,1979,1978,1977,1976,1975,1974,1973,1972,1971,1970,1969,1968,1967,1966,1965,1964,1963,1962,1961
This statistics in other country:
AfghanistanAlbaniaAlgeriaAngolaAntigua and BarbudaArab WorldArgentinaArmeniaArubaAustraliaAustriaAzerbaijanBahamas, TheBahrainBangladeshBarbadosBelarusBelgiumBelizeBeninBermudaBhutanBoliviaBosnia and HerzegovinaBotswanaBrazilBrunei DarussalamBulgariaBurkina FasoBurundiCabo VerdeCambodiaCameroonCanadaCaribbean small statesCentral African RepublicCentral Europe and the BalticsChadChileChinaColombiaComorosCongo, Dem. Rep.Congo, Rep.Costa RicaCote d'IvoireCroatiaCubaCyprusCzech RepublicDenmarkDjiboutiDominicaDominican RepublicEarly-demographic dividendEast Asia & PacificEast Asia & Pacific (excluding high income)East Asia & Pacific (IDA & IBRD countries)EcuadorEgypt, Arab Rep.El SalvadorEquatorial GuineaEritreaEstoniaEthiopiaEuro areaEurope & Central AsiaEurope & Central Asia (excluding high income)Europe & Central Asia (IDA & IBRD countries)European UnionFaroe IslandsFijiFinlandFragile and conflict affected situationsFranceGabonGambia, TheGeorgiaGermanyGhanaGreeceGrenadaGuatemalaGuineaGuinea-BissauGuyanaHaitiHeavily indebted poor countries (HIPC)High incomeHondurasHong Kong SAR, ChinaHungaryIBRD onlyIcelandIDA & IBRD totalIDA blendIDA onlyIDA totalIndiaIndonesiaIran, Islamic Rep.IraqIrelandIsraelItalyJamaicaJapanJordanKazakhstanKenyaKiribatiKorea, Rep.KosovoKuwaitKyrgyz RepublicLao PDRLate-demographic dividendLatin America & Caribbean Latin America & Caribbean (excluding high income)Latin America & the Caribbean (IDA & IBRD countries)LatviaLeast developed countries: UN classificationLebanonLesothoLiberiaLibyaLithuaniaLow & middle incomeLow incomeLower middle incomeLuxembourgMacao SAR, ChinaMacedonia, FYRMadagascarMalawiMalaysiaMaldivesMaliMaltaMauritaniaMauritiusMexicoMicronesia, Fed. Sts.Middle East & North AfricaMiddle East & North Africa (excluding high income)Middle East & North Africa (IDA & IBRD countries)Middle incomeMoldovaMongoliaMontenegroMoroccoMozambiqueNamibiaNepalNetherlandsNew CaledoniaNew ZealandNicaraguaNigerNigeriaNorth AmericaNorwayOECD membersOmanOther small statesPakistanPanamaPapua New GuineaParaguayPeruPhilippinesPolandPortugalPost-demographic dividendPre-demographic dividendPuerto RicoQatarRomaniaRussian FederationRwandaSaudi ArabiaSenegalSerbiaSeychellesSierra LeoneSingaporeSlovak RepublicSloveniaSmall statesSolomon IslandsSouth AfricaSouth AsiaSouth Asia (IDA & IBRD)South SudanSpainSri LankaSt. Kitts and NevisSt. LuciaSt. Vincent and the GrenadinesSub-Saharan Africa Sub-Saharan Africa (excluding high income)Sub-Saharan Africa (IDA & IBRD countries)SudanSurinameSwazilandSwedenSwitzerlandSyrian Arab RepublicTajikistanTanzaniaThailandTimor-LesteTogoTongaTrinidad and TobagoTunisiaTurkeyTurkmenistanUgandaUkraineUnited Arab EmiratesUnited KingdomUnited StatesUpper middle incomeUruguayUzbekistanVanuatuVenezuela, RBVietnamWest Bank and GazaWorldYemen, Rep.ZambiaZimbabwe Timeline:
This timeline shows a graph from 1961 to 2016 of Singapore. No data until 1960. Number of actual observations by date: 56.
Source name:
World Development Indicators
Source organization:
World Bank national accounts data, and OECD National Accounts data files.
Categories, topics:
Economy & Growth
Last updated:
apr 23, 2017
Indicators value changes by year
Minimum:
-23.161 mln
jan 1, 1962
Maximum:
163.506 bln
jan 1, 2015
At the date of observation
Value
Absolute change
Change from previous value
jan 1, 1961
-16.366 mln
-16.366 mln
0.0%
jan 1, 1962
-23.161 mln
-6.795 mln
41.52%
jan 1, 1963
41.846 mln
+65.007 mln
-280.68%
jan 1, 1964
25.382 mln
-16.464 mln
-39.34%
jan 1, 1965
80.001 mln
+54.619 mln
215.19%
jan 1, 1966
103.717 mln
+23.716 mln
29.64%
jan 1, 1967
159.088 mln
+55.37 mln
53.39%
jan 1, 1968
180.55 mln
+21.462 mln
13.49%
jan 1, 1969
273.096 mln
+92.545 mln
51.26%
jan 1, 1970
312.753 mln
+39.658 mln
14.52%
jan 1, 1971
368.189 mln
+55.436 mln
17.73%
jan 1, 1972
446.394 mln
+78.205 mln
21.24%
jan 1, 1973
688.235 mln
+241.842 mln
54.18%
jan 1, 1974
1.104 bln
+415.338 mln
60.35%
jan 1, 1975
1.539 bln
+435.574 mln
39.47%
jan 1, 1976
1.661 bln
+121.446 mln
7.89%
jan 1, 1977
2.066 bln
+405.446 mln
24.42%
jan 1, 1978
2.235 bln
+169.147 mln
8.19%
jan 1, 1979
2.566 bln
+330.403 mln
14.78%
jan 1, 1980
3.389 bln
+823.68 mln
32.1%
jan 1, 1981
4.532 bln
+1.143 bln
33.72%
jan 1, 1982
5.864 bln
+1.331 bln
29.37%
jan 1, 1983
7.147 bln
+1.283 bln
21.88%
jan 1, 1984
8.364 bln
+1.217 bln
17.03%
jan 1, 1985
9.228 bln
+864.469 mln
10.34%
jan 1, 1986
7.93 bln
-1.299 bln
-14.07%
jan 1, 1987
7.284 bln
-645.875 mln
-8.15%
jan 1, 1988
8.259 bln
+975.495 mln
13.39%
jan 1, 1989
10.9 bln
+2.641 bln
31.98%
jan 1, 1990
13.732 bln
+2.831 bln
25.97%
jan 1, 1991
16.518 bln
+2.786 bln
20.29%
jan 1, 1992
21.451 bln
+4.932 bln
29.86%
jan 1, 1993
24.84 bln
+3.389 bln
15.8%
jan 1, 1994
28.533 bln
+3.693 bln
14.87%
jan 1, 1995
36.163 bln
+7.631 bln
26.74%
jan 1, 1996
44.419 bln
+8.256 bln
22.83%
jan 1, 1997
49.391 bln
+4.971 bln
11.19%
jan 1, 1998
52.71 bln
+3.319 bln
6.72%
jan 1, 1999
45.317 bln
-7.393 bln
-14.03%
jan 1, 2000
42.738 bln
-2.58 bln
-5.69%
jan 1, 2001
45.224 bln
+2.487 bln
5.82%
jan 1, 2002
39.259 bln
-5.965 bln
-13.19%
jan 1, 2003
39.654 bln
+394.608 mln
1.01%
jan 1, 2004
43.818 bln
+4.164 bln
10.5%
jan 1, 2005
56.506 bln
+12.688 bln
28.96%
jan 1, 2006
65.232 bln
+8.726 bln
15.44%
jan 1, 2007
77.11 bln
+11.878 bln
18.21%
jan 1, 2008
97.094 bln
+19.984 bln
25.92%
jan 1, 2009
98.649 bln
+1.555 bln
1.6%
jan 1, 2010
98.504 bln
-144.854 mln
-0.15%
jan 1, 2011
128.35 bln
+29.846 bln
30.3%
jan 1, 2012
149.136 bln
+20.786 bln
16.2%
jan 1, 2013
154.504 bln
+5.368 bln
3.6%
jan 1, 2014
160.442 bln
+5.938 bln
3.84%
jan 1, 2015
163.506 bln
+3.064 bln
1.91%
jan 1, 2016
155.629 bln
-7.877 bln
-4.82%
Ranking of countries by current statistics by years


Comments: