29
/
en
AIzaSyAYiBZKx7MnpbEhh9jyipgxe19OcubqV5w
April 1, 2024
25732
Central Europe and the Baltics
CEB
false
2
1
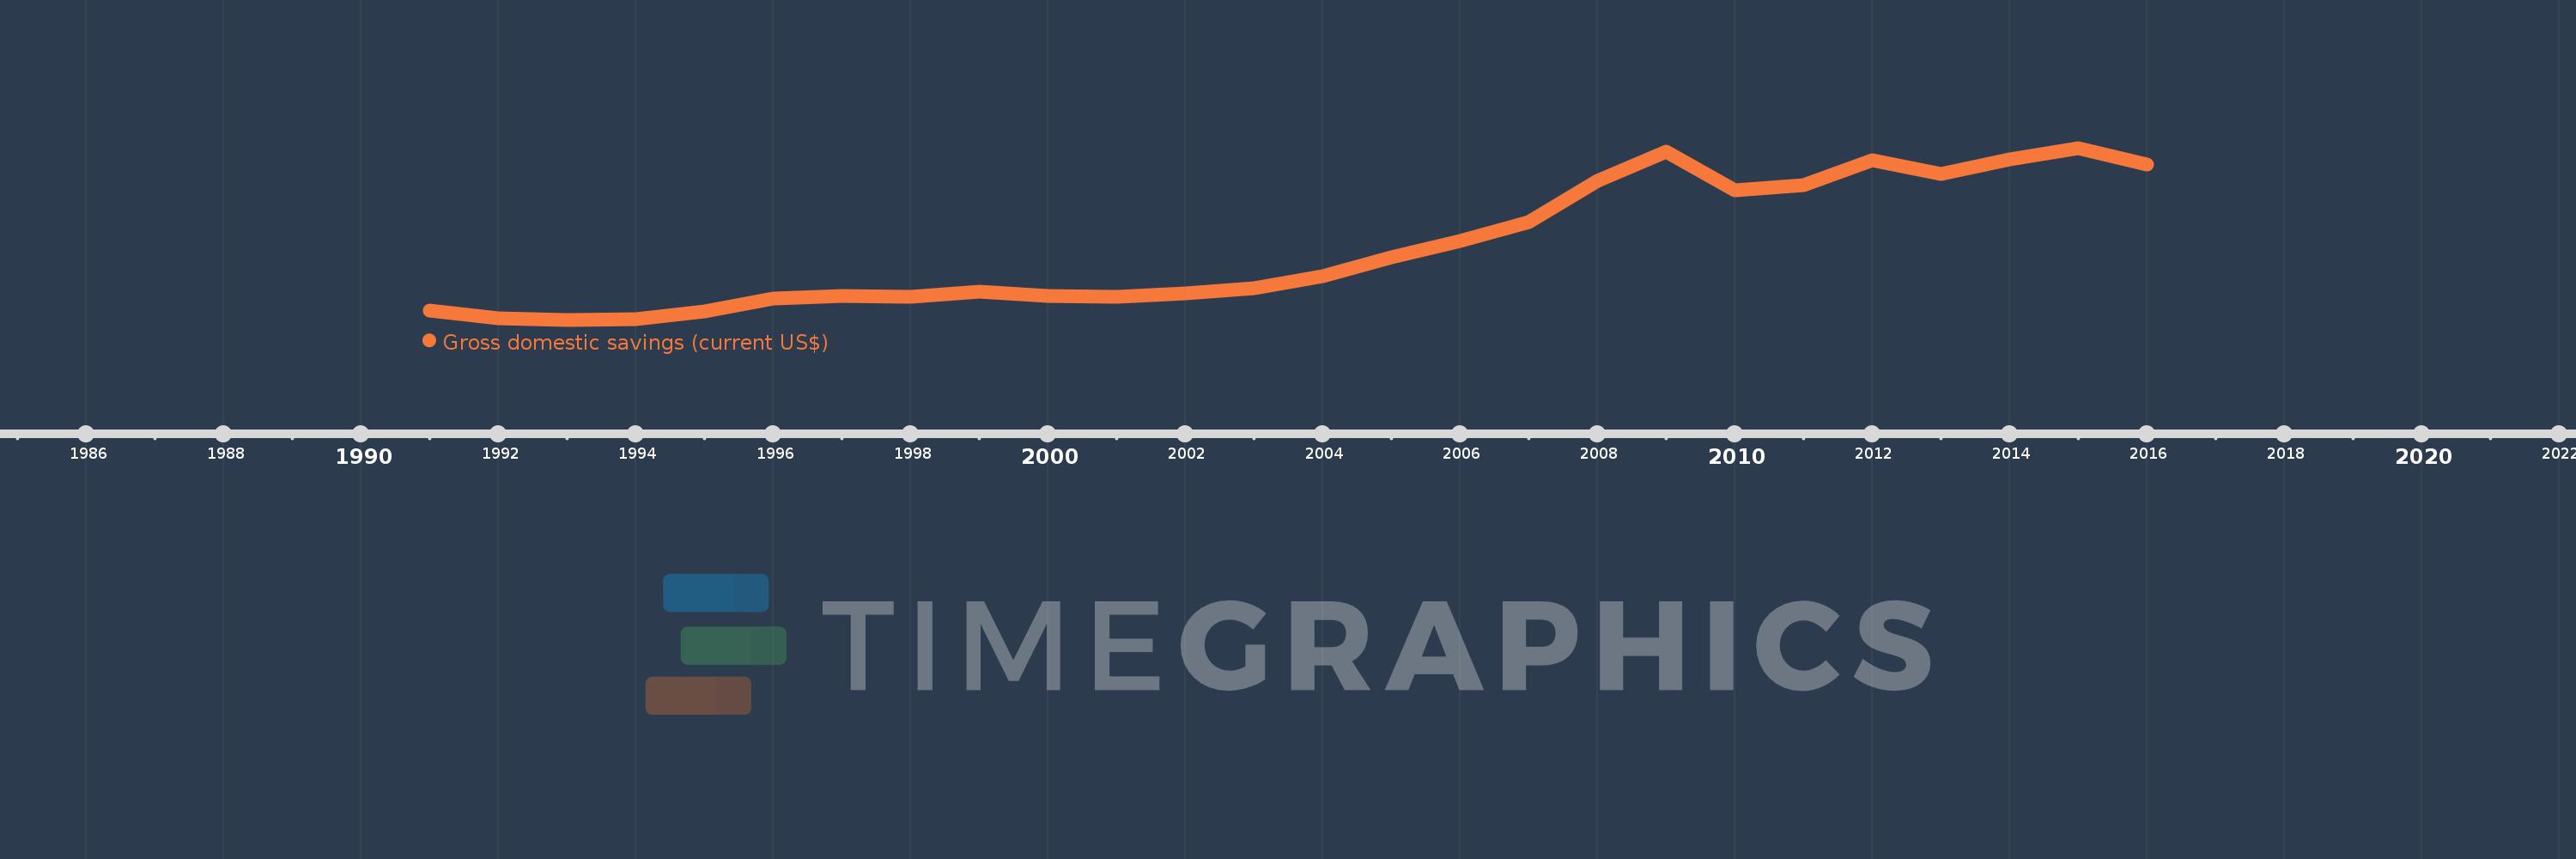
Gross domestic savings (current US$)
2016,2015,2014,2013,2012,2011,2010,2009,2008,2007,2006,2005,2004,2003,2002,2001,2000,1999,1998,1997,1996,1995,1994,1993,1992,1991
This statistics in other country:
AfghanistanAlbaniaAlgeriaAngolaAntigua and BarbudaArab WorldArgentinaArmeniaArubaAustraliaAustriaAzerbaijanBahamas, TheBahrainBangladeshBarbadosBelarusBelgiumBelizeBeninBermudaBhutanBoliviaBosnia and HerzegovinaBotswanaBrazilBrunei DarussalamBulgariaBurkina FasoBurundiCabo VerdeCambodiaCameroonCanadaCaribbean small statesCentral African RepublicCentral Europe and the BalticsChadChileChinaColombiaComorosCongo, Dem. Rep.Congo, Rep.Costa RicaCote d'IvoireCroatiaCubaCyprusCzech RepublicDenmarkDjiboutiDominicaDominican RepublicEarly-demographic dividendEast Asia & PacificEast Asia & Pacific (excluding high income)East Asia & Pacific (IDA & IBRD countries)EcuadorEgypt, Arab Rep.El SalvadorEquatorial GuineaEritreaEstoniaEthiopiaEuro areaEurope & Central AsiaEurope & Central Asia (excluding high income)Europe & Central Asia (IDA & IBRD countries)European UnionFaroe IslandsFijiFinlandFragile and conflict affected situationsFranceGabonGambia, TheGeorgiaGermanyGhanaGreeceGrenadaGuatemalaGuineaGuinea-BissauGuyanaHaitiHeavily indebted poor countries (HIPC)High incomeHondurasHong Kong SAR, ChinaHungaryIBRD onlyIcelandIDA & IBRD totalIDA blendIDA onlyIDA totalIndiaIndonesiaIran, Islamic Rep.IraqIrelandIsraelItalyJamaicaJapanJordanKazakhstanKenyaKiribatiKorea, Rep.KosovoKuwaitKyrgyz RepublicLao PDRLate-demographic dividendLatin America & Caribbean Latin America & Caribbean (excluding high income)Latin America & the Caribbean (IDA & IBRD countries)LatviaLeast developed countries: UN classificationLebanonLesothoLiberiaLibyaLithuaniaLow & middle incomeLow incomeLower middle incomeLuxembourgMacao SAR, ChinaMacedonia, FYRMadagascarMalawiMalaysiaMaldivesMaliMaltaMauritaniaMauritiusMexicoMicronesia, Fed. Sts.Middle East & North AfricaMiddle East & North Africa (excluding high income)Middle East & North Africa (IDA & IBRD countries)Middle incomeMoldovaMongoliaMontenegroMoroccoMozambiqueNamibiaNepalNetherlandsNew CaledoniaNew ZealandNicaraguaNigerNigeriaNorth AmericaNorwayOECD membersOmanOther small statesPakistanPanamaPapua New GuineaParaguayPeruPhilippinesPolandPortugalPost-demographic dividendPre-demographic dividendPuerto RicoQatarRomaniaRussian FederationRwandaSaudi ArabiaSenegalSerbiaSeychellesSierra LeoneSingaporeSlovak RepublicSloveniaSmall statesSolomon IslandsSouth AfricaSouth AsiaSouth Asia (IDA & IBRD)South SudanSpainSri LankaSt. Kitts and NevisSt. LuciaSt. Vincent and the GrenadinesSub-Saharan Africa Sub-Saharan Africa (excluding high income)Sub-Saharan Africa (IDA & IBRD countries)SudanSurinameSwazilandSwedenSwitzerlandSyrian Arab RepublicTajikistanTanzaniaThailandTimor-LesteTogoTongaTrinidad and TobagoTunisiaTurkeyTurkmenistanUgandaUkraineUnited Arab EmiratesUnited KingdomUnited StatesUpper middle incomeUruguayUzbekistanVanuatuVenezuela, RBVietnamWest Bank and GazaWorldYemen, Rep.ZambiaZimbabwe Timeline:
This timeline shows a graph from 1991 to 2016 of Central Europe and the Baltics. No data until 1990. Number of actual observations by date: 26.
Source name:
World Development Indicators
Source organization:
World Bank national accounts data, and OECD National Accounts data files.
Categories, topics:
Economy & Growth
Last updated:
apr 23, 2017
Indicators value changes by year
Minimum:
46.567 bln
jan 1, 1993
Maximum:
362.387 bln
jan 1, 2015
At the date of observation
Value
Absolute change
Change from previous value
jan 1, 1991
64.146 bln
+64.146 bln
0.0%
jan 1, 1992
49.939 bln
-14.207 bln
-22.15%
jan 1, 1993
46.567 bln
-3.372 bln
-6.75%
jan 1, 1994
47.245 bln
+678.02 mln
1.46%
jan 1, 1995
62.139 bln
+14.894 bln
31.52%
jan 1, 1996
86.172 bln
+24.033 bln
38.68%
jan 1, 1997
90.005 bln
+3.833 bln
4.45%
jan 1, 1998
88.751 bln
-1.254 bln
-1.39%
jan 1, 1999
97.735 bln
+8.983 bln
10.12%
jan 1, 2000
90.544 bln
-7.191 bln
-7.36%
jan 1, 2001
88.923 bln
-1.621 bln
-1.79%
jan 1, 2002
95.665 bln
+6.743 bln
7.58%
jan 1, 2003
104.478 bln
+8.813 bln
9.21%
jan 1, 2004
126.141 bln
+21.663 bln
20.73%
jan 1, 2005
161.336 bln
+35.195 bln
27.9%
jan 1, 2006
191.938 bln
+30.602 bln
18.97%
jan 1, 2007
226.145 bln
+34.207 bln
17.82%
jan 1, 2008
302.389 bln
+76.244 bln
33.71%
jan 1, 2009
355.679 bln
+53.29 bln
17.62%
jan 1, 2010
284.153 bln
-71.526 bln
-20.11%
jan 1, 2011
293.669 bln
+9.516 bln
3.35%
jan 1, 2012
339.197 bln
+45.528 bln
15.5%
jan 1, 2013
314.609 bln
-24.587 bln
-7.25%
jan 1, 2014
341.837 bln
+27.228 bln
8.65%
jan 1, 2015
362.387 bln
+20.549 bln
6.01%
jan 1, 2016
331.542 bln
-30.845 bln
-8.51%
Ranking of countries by current statistics by years


Comments: