29
/
en
AIzaSyAYiBZKx7MnpbEhh9jyipgxe19OcubqV5w
April 1, 2024
213009
Nigeria
NGA
true
2
1
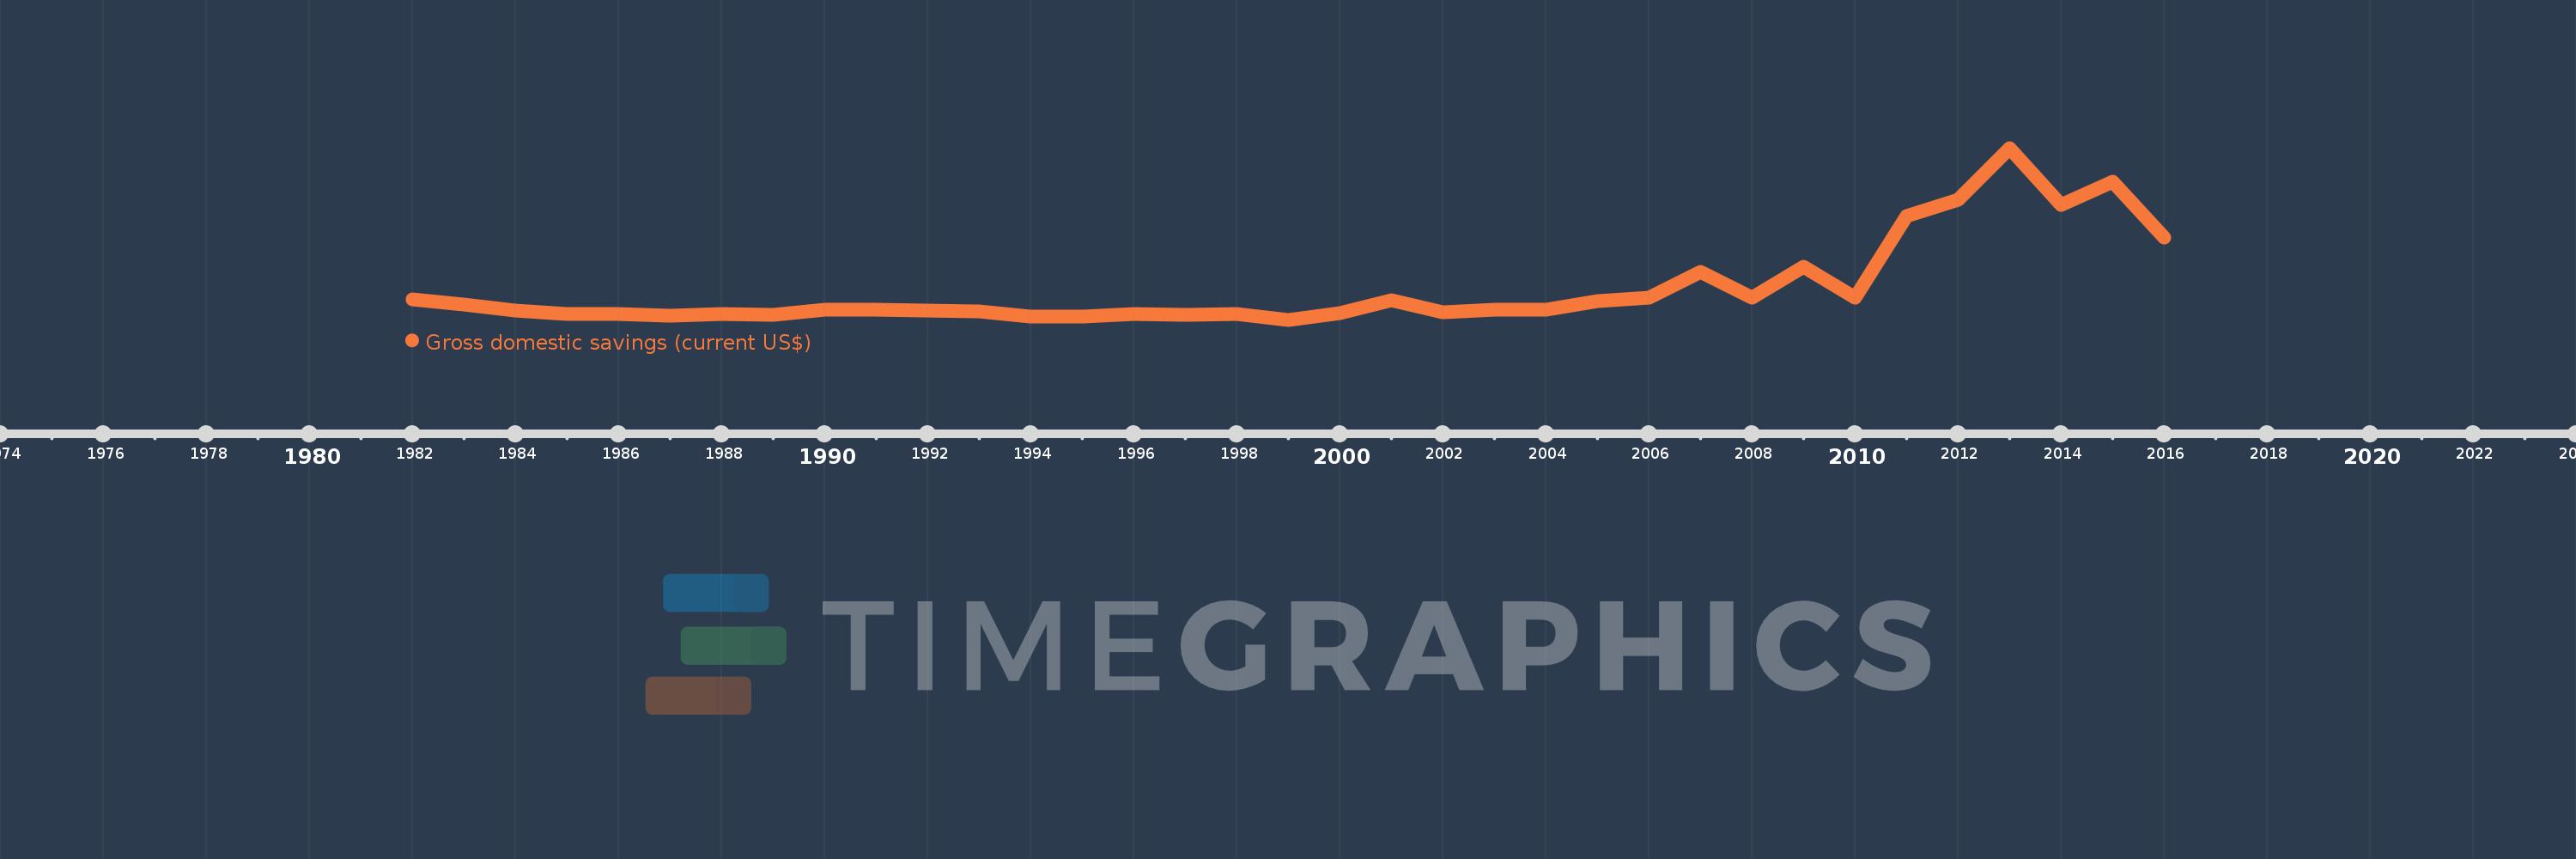
Gross domestic savings (current US$)
2016,2015,2014,2013,2012,2011,2010,2009,2008,2007,2006,2005,2004,2003,2002,2001,2000,1999,1998,1997,1996,1995,1994,1993,1992,1991,1990,1989,1988,1987,1986,1985,1984,1983,1982
This statistics in other country:
AfghanistanAlbaniaAlgeriaAngolaAntigua and BarbudaArab WorldArgentinaArmeniaArubaAustraliaAustriaAzerbaijanBahamas, TheBahrainBangladeshBarbadosBelarusBelgiumBelizeBeninBermudaBhutanBoliviaBosnia and HerzegovinaBotswanaBrazilBrunei DarussalamBulgariaBurkina FasoBurundiCabo VerdeCambodiaCameroonCanadaCaribbean small statesCentral African RepublicCentral Europe and the BalticsChadChileChinaColombiaComorosCongo, Dem. Rep.Congo, Rep.Costa RicaCote d'IvoireCroatiaCubaCyprusCzech RepublicDenmarkDjiboutiDominicaDominican RepublicEarly-demographic dividendEast Asia & PacificEast Asia & Pacific (excluding high income)East Asia & Pacific (IDA & IBRD countries)EcuadorEgypt, Arab Rep.El SalvadorEquatorial GuineaEritreaEstoniaEthiopiaEuro areaEurope & Central AsiaEurope & Central Asia (excluding high income)Europe & Central Asia (IDA & IBRD countries)European UnionFaroe IslandsFijiFinlandFragile and conflict affected situationsFranceGabonGambia, TheGeorgiaGermanyGhanaGreeceGrenadaGuatemalaGuineaGuinea-BissauGuyanaHaitiHeavily indebted poor countries (HIPC)High incomeHondurasHong Kong SAR, ChinaHungaryIBRD onlyIcelandIDA & IBRD totalIDA blendIDA onlyIDA totalIndiaIndonesiaIran, Islamic Rep.IraqIrelandIsraelItalyJamaicaJapanJordanKazakhstanKenyaKiribatiKorea, Rep.KosovoKuwaitKyrgyz RepublicLao PDRLate-demographic dividendLatin America & Caribbean Latin America & Caribbean (excluding high income)Latin America & the Caribbean (IDA & IBRD countries)LatviaLeast developed countries: UN classificationLebanonLesothoLiberiaLibyaLithuaniaLow & middle incomeLow incomeLower middle incomeLuxembourgMacao SAR, ChinaMacedonia, FYRMadagascarMalawiMalaysiaMaldivesMaliMaltaMauritaniaMauritiusMexicoMicronesia, Fed. Sts.Middle East & North AfricaMiddle East & North Africa (excluding high income)Middle East & North Africa (IDA & IBRD countries)Middle incomeMoldovaMongoliaMontenegroMoroccoMozambiqueNamibiaNepalNetherlandsNew CaledoniaNew ZealandNicaraguaNigerNigeriaNorth AmericaNorwayOECD membersOmanOther small statesPakistanPanamaPapua New GuineaParaguayPeruPhilippinesPolandPortugalPost-demographic dividendPre-demographic dividendPuerto RicoQatarRomaniaRussian FederationRwandaSaudi ArabiaSenegalSerbiaSeychellesSierra LeoneSingaporeSlovak RepublicSloveniaSmall statesSolomon IslandsSouth AfricaSouth AsiaSouth Asia (IDA & IBRD)South SudanSpainSri LankaSt. Kitts and NevisSt. LuciaSt. Vincent and the GrenadinesSub-Saharan Africa Sub-Saharan Africa (excluding high income)Sub-Saharan Africa (IDA & IBRD countries)SudanSurinameSwazilandSwedenSwitzerlandSyrian Arab RepublicTajikistanTanzaniaThailandTimor-LesteTogoTongaTrinidad and TobagoTunisiaTurkeyTurkmenistanUgandaUkraineUnited Arab EmiratesUnited KingdomUnited StatesUpper middle incomeUruguayUzbekistanVanuatuVenezuela, RBVietnamWest Bank and GazaWorldYemen, Rep.ZambiaZimbabwe Timeline:
This timeline shows a graph from 1982 to 2016 of Nigeria. No data until 1981. Number of actual observations by date: 35.
Source name:
World Development Indicators
Source organization:
World Bank national accounts data, and OECD National Accounts data files.
Categories, topics:
Economy & Growth
Last updated:
apr 23, 2017
Indicators value changes by year
Minimum:
585.575 mln
jan 1, 1999
Maximum:
153.982 bln
jan 1, 2013
At the date of observation
Value
Absolute change
Change from previous value
jan 1, 1982
18.386 bln
+18.386 bln
0.0%
jan 1, 1983
14.216 bln
-4.17 bln
-22.68%
jan 1, 1984
8.476 bln
-5.739 bln
-40.37%
jan 1, 1985
5.764 bln
-2.713 bln
-32.0%
jan 1, 1986
5.841 bln
+76.942 mln
1.33%
jan 1, 1987
3.858 bln
-1.983 bln
-33.95%
jan 1, 1988
5.999 bln
+2.142 bln
55.51%
jan 1, 1989
4.712 bln
-1.288 bln
-21.47%
jan 1, 1990
9.527 bln
+4.816 bln
102.21%
jan 1, 1991
9.869 bln
+341.61 mln
3.59%
jan 1, 1992
8.853 bln
-1.016 bln
-10.29%
jan 1, 1993
7.85 bln
-1.003 bln
-11.33%
jan 1, 1994
3.657 bln
-4.193 bln
-53.41%
jan 1, 1995
3.167 bln
-490.621 mln
-13.42%
jan 1, 1996
5.378 bln
+2.211 bln
69.83%
jan 1, 1997
4.93 bln
-448.032 mln
-8.33%
jan 1, 1998
5.395 bln
+465.574 mln
9.44%
jan 1, 1999
585.575 mln
-4.81 bln
-89.15%
jan 1, 2000
6.781 bln
+6.196 bln
1.06K%
jan 1, 2001
18.142 bln
+11.361 bln
167.54%
jan 1, 2002
7.361 bln
-10.781 bln
-59.43%
jan 1, 2003
9.203 bln
+1.842 bln
25.03%
jan 1, 2004
9.655 bln
+451.409 mln
4.9%
jan 1, 2005
16.932 bln
+7.277 bln
75.37%
jan 1, 2006
20.241 bln
+3.309 bln
19.55%
jan 1, 2007
43.465 bln
+23.223 bln
114.73%
jan 1, 2008
20.391 bln
-23.073 bln
-53.09%
jan 1, 2009
48.111 bln
+27.72 bln
135.94%
jan 1, 2010
20.048 bln
-28.063 bln
-58.33%
jan 1, 2011
92.884 bln
+72.836 bln
363.31%
jan 1, 2012
107.372 bln
+14.488 bln
15.6%
jan 1, 2013
153.982 bln
+46.609 bln
43.41%
jan 1, 2014
102.761 bln
-51.221 bln
-33.26%
jan 1, 2015
123.863 bln
+21.102 bln
20.54%
jan 1, 2016
73.875 bln
-49.988 bln
-40.36%
Ranking of countries by current statistics by years


Comments: