29
/
en
AIzaSyAYiBZKx7MnpbEhh9jyipgxe19OcubqV5w
April 1, 2024
116939
Cyprus
CYP
true
2
1
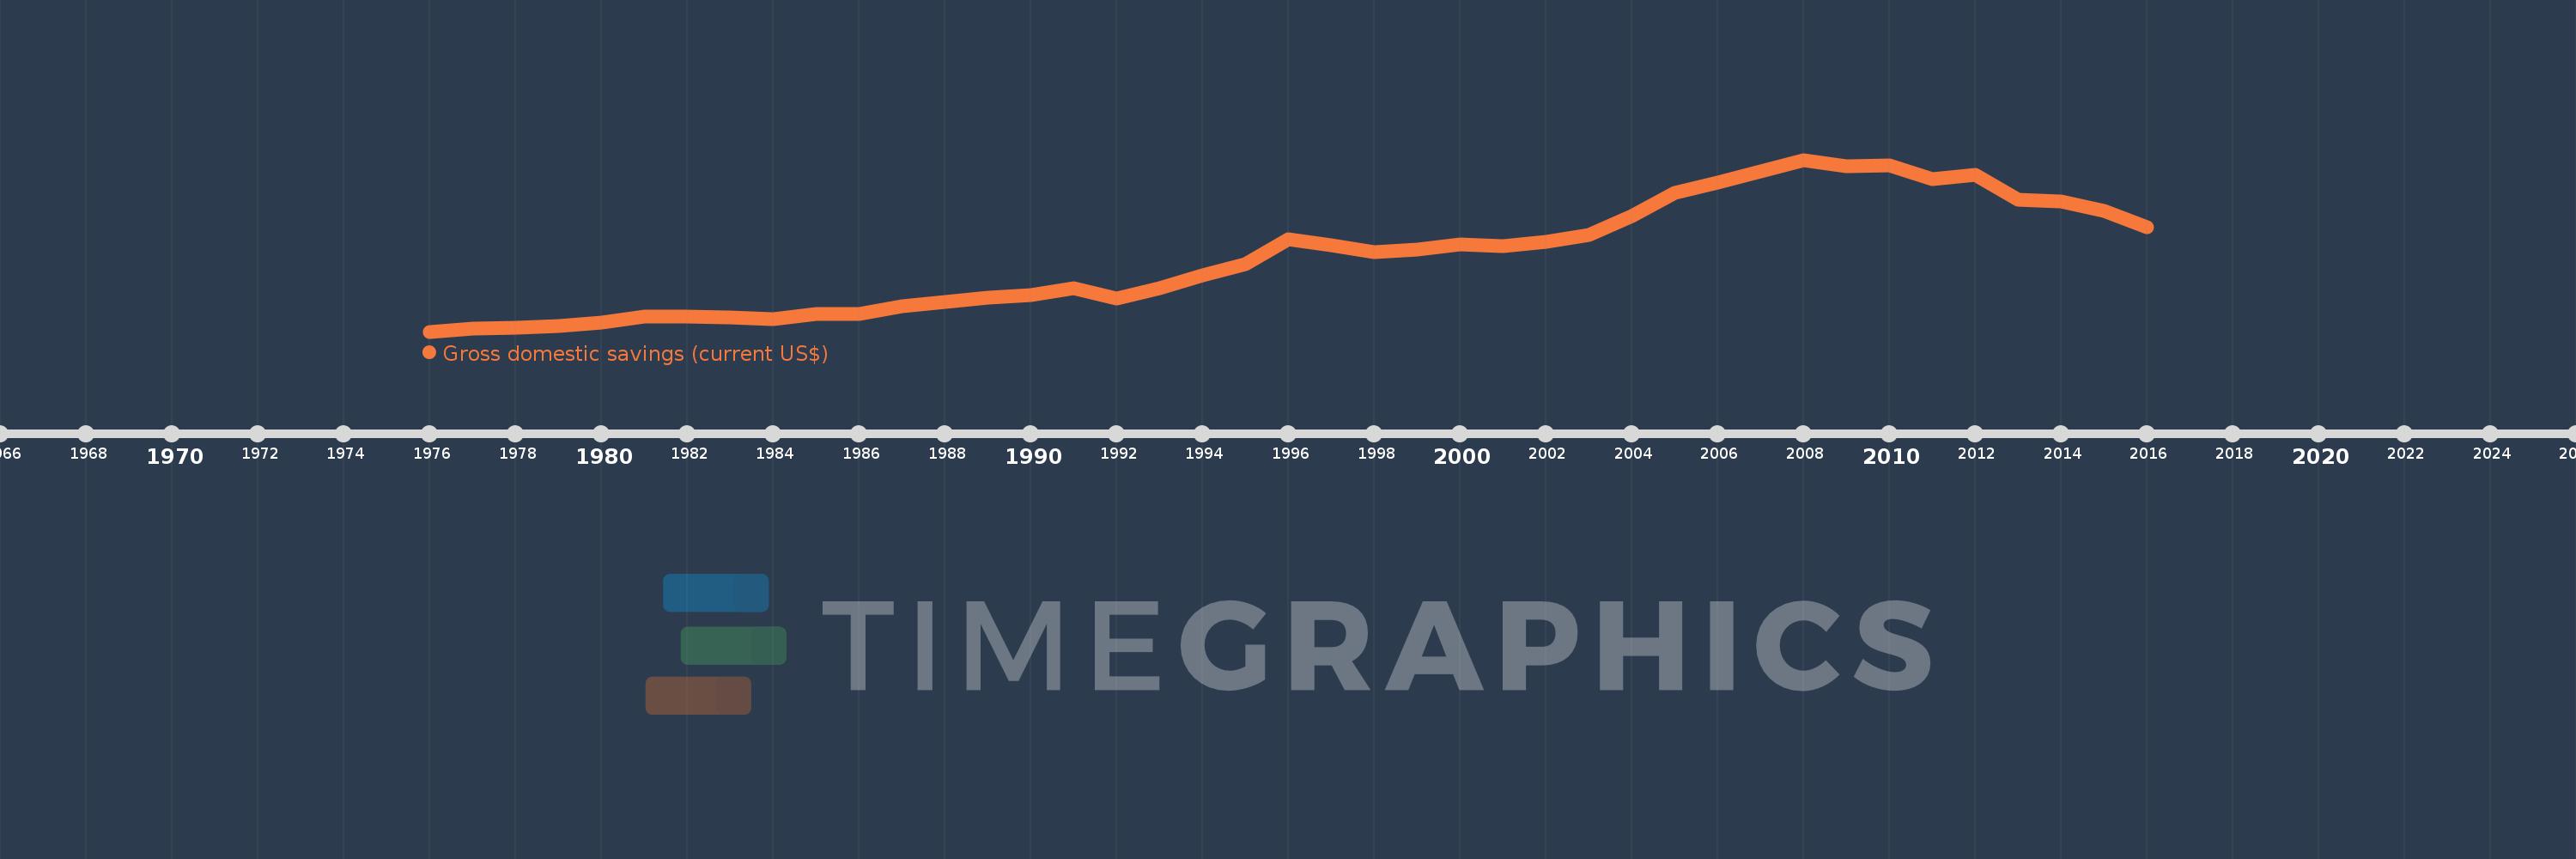
Gross domestic savings (current US$)
2016,2015,2014,2013,2012,2011,2010,2009,2008,2007,2006,2005,2004,2003,2002,2001,2000,1999,1998,1997,1996,1995,1994,1993,1992,1991,1990,1989,1988,1987,1986,1985,1984,1983,1982,1981,1980,1979,1978,1977,1976
This statistics in other country:
AfghanistanAlbaniaAlgeriaAngolaAntigua and BarbudaArab WorldArgentinaArmeniaArubaAustraliaAustriaAzerbaijanBahamas, TheBahrainBangladeshBarbadosBelarusBelgiumBelizeBeninBermudaBhutanBoliviaBosnia and HerzegovinaBotswanaBrazilBrunei DarussalamBulgariaBurkina FasoBurundiCabo VerdeCambodiaCameroonCanadaCaribbean small statesCentral African RepublicCentral Europe and the BalticsChadChileChinaColombiaComorosCongo, Dem. Rep.Congo, Rep.Costa RicaCote d'IvoireCroatiaCubaCyprusCzech RepublicDenmarkDjiboutiDominicaDominican RepublicEarly-demographic dividendEast Asia & PacificEast Asia & Pacific (excluding high income)East Asia & Pacific (IDA & IBRD countries)EcuadorEgypt, Arab Rep.El SalvadorEquatorial GuineaEritreaEstoniaEthiopiaEuro areaEurope & Central AsiaEurope & Central Asia (excluding high income)Europe & Central Asia (IDA & IBRD countries)European UnionFaroe IslandsFijiFinlandFragile and conflict affected situationsFranceGabonGambia, TheGeorgiaGermanyGhanaGreeceGrenadaGuatemalaGuineaGuinea-BissauGuyanaHaitiHeavily indebted poor countries (HIPC)High incomeHondurasHong Kong SAR, ChinaHungaryIBRD onlyIcelandIDA & IBRD totalIDA blendIDA onlyIDA totalIndiaIndonesiaIran, Islamic Rep.IraqIrelandIsraelItalyJamaicaJapanJordanKazakhstanKenyaKiribatiKorea, Rep.KosovoKuwaitKyrgyz RepublicLao PDRLate-demographic dividendLatin America & Caribbean Latin America & Caribbean (excluding high income)Latin America & the Caribbean (IDA & IBRD countries)LatviaLeast developed countries: UN classificationLebanonLesothoLiberiaLibyaLithuaniaLow & middle incomeLow incomeLower middle incomeLuxembourgMacao SAR, ChinaMacedonia, FYRMadagascarMalawiMalaysiaMaldivesMaliMaltaMauritaniaMauritiusMexicoMicronesia, Fed. Sts.Middle East & North AfricaMiddle East & North Africa (excluding high income)Middle East & North Africa (IDA & IBRD countries)Middle incomeMoldovaMongoliaMontenegroMoroccoMozambiqueNamibiaNepalNetherlandsNew CaledoniaNew ZealandNicaraguaNigerNigeriaNorth AmericaNorwayOECD membersOmanOther small statesPakistanPanamaPapua New GuineaParaguayPeruPhilippinesPolandPortugalPost-demographic dividendPre-demographic dividendPuerto RicoQatarRomaniaRussian FederationRwandaSaudi ArabiaSenegalSerbiaSeychellesSierra LeoneSingaporeSlovak RepublicSloveniaSmall statesSolomon IslandsSouth AfricaSouth AsiaSouth Asia (IDA & IBRD)South SudanSpainSri LankaSt. Kitts and NevisSt. LuciaSt. Vincent and the GrenadinesSub-Saharan Africa Sub-Saharan Africa (excluding high income)Sub-Saharan Africa (IDA & IBRD countries)SudanSurinameSwazilandSwedenSwitzerlandSyrian Arab RepublicTajikistanTanzaniaThailandTimor-LesteTogoTongaTrinidad and TobagoTunisiaTurkeyTurkmenistanUgandaUkraineUnited Arab EmiratesUnited KingdomUnited StatesUpper middle incomeUruguayUzbekistanVanuatuVenezuela, RBVietnamWest Bank and GazaWorldYemen, Rep.ZambiaZimbabwe Timeline:
This timeline shows a graph from 1976 to 2016 of Cyprus. No data until 1975. Number of actual observations by date: 41.
Source name:
World Development Indicators
Source organization:
World Bank national accounts data, and OECD National Accounts data files.
Categories, topics:
Economy & Growth
Last updated:
apr 23, 2017
Indicators value changes by year
Minimum:
6.481 mln
jan 1, 1976
Maximum:
4.753 bln
jan 1, 2008
At the date of observation
Value
Absolute change
Change from previous value
jan 1, 1976
6.481 mln
+6.481 mln
0.0%
jan 1, 1977
78.848 mln
+72.366 mln
1.12K%
jan 1, 1978
109.773 mln
+30.925 mln
39.22%
jan 1, 1979
160.259 mln
+50.486 mln
45.99%
jan 1, 1980
253.119 mln
+92.86 mln
57.94%
jan 1, 1981
430.976 mln
+177.857 mln
70.27%
jan 1, 1982
432.989 mln
+2.013 mln
0.47%
jan 1, 1983
397.339 mln
-35.649 mln
-8.23%
jan 1, 1984
357.495 mln
-39.844 mln
-10.03%
jan 1, 1985
481.918 mln
+124.423 mln
34.8%
jan 1, 1986
492.084 mln
+10.166 mln
2.11%
jan 1, 1987
696.569 mln
+204.485 mln
41.55%
jan 1, 1988
835.363 mln
+138.794 mln
19.93%
jan 1, 1989
942.625 mln
+107.262 mln
12.84%
jan 1, 1990
1.026 bln
+83.143 mln
8.82%
jan 1, 1991
1.199 bln
+172.878 mln
16.85%
jan 1, 1992
913.627 mln
-285.019 mln
-23.78%
jan 1, 1993
1.211 bln
+297.097 mln
32.52%
jan 1, 1994
1.559 bln
+348.149 mln
28.76%
jan 1, 1995
1.865 bln
+306.351 mln
19.65%
jan 1, 1996
2.567 bln
+701.4 mln
37.6%
jan 1, 1997
2.397 bln
-169.76 mln
-6.61%
jan 1, 1998
2.212 bln
-184.435 mln
-7.69%
jan 1, 1999
2.263 bln
+50.467 mln
2.28%
jan 1, 2000
2.422 bln
+159.218 mln
7.04%
jan 1, 2001
2.366 bln
-55.856 mln
-2.31%
jan 1, 2002
2.492 bln
+126.091 mln
5.33%
jan 1, 2003
2.674 bln
+181.4 mln
7.28%
jan 1, 2004
3.19 bln
+516.171 mln
19.31%
jan 1, 2005
3.85 bln
+660.204 mln
20.7%
jan 1, 2006
4.113 bln
+263.169 mln
6.84%
jan 1, 2007
4.442 bln
+328.557 mln
7.99%
jan 1, 2008
4.753 bln
+310.817 mln
7.0%
jan 1, 2009
4.568 bln
-184.337 mln
-3.88%
jan 1, 2010
4.605 bln
+37.114 mln
0.81%
jan 1, 2011
4.221 bln
-384.519 mln
-8.35%
jan 1, 2012
4.342 bln
+120.607 mln
2.86%
jan 1, 2013
3.653 bln
-688.702 mln
-15.86%
jan 1, 2014
3.603 bln
-50.204 mln
-1.37%
jan 1, 2015
3.35 bln
-252.224 mln
-7.0%
jan 1, 2016
2.895 bln
-455.429 mln
-13.59%
Ranking of countries by current statistics by years


Comments: