29
/
en
AIzaSyAYiBZKx7MnpbEhh9jyipgxe19OcubqV5w
April 1, 2024
59821
Sub-Saharan Africa (excluding high income)
SSA
false
2
1
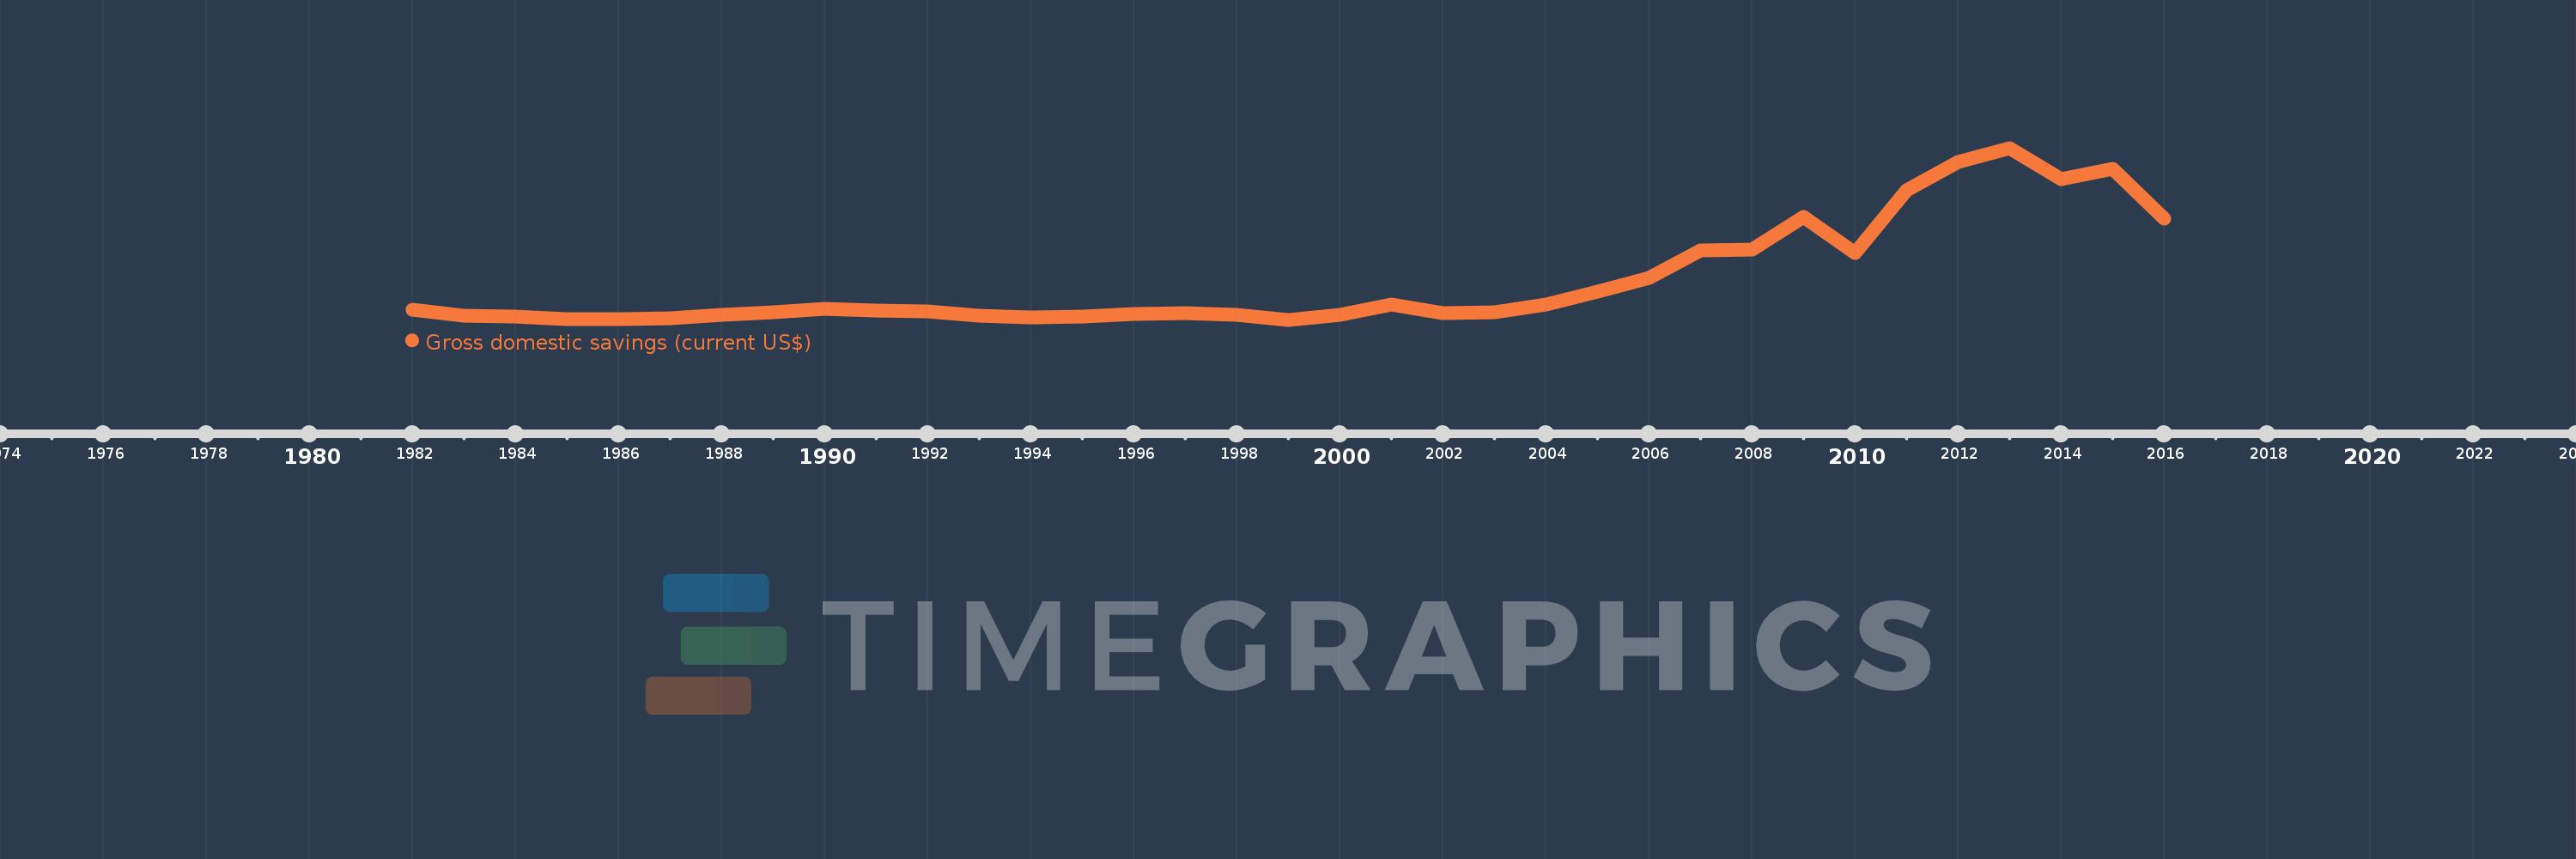
Gross domestic savings (current US$)
2016,2015,2014,2013,2012,2011,2010,2009,2008,2007,2006,2005,2004,2003,2002,2001,2000,1999,1998,1997,1996,1995,1994,1993,1992,1991,1990,1989,1988,1987,1986,1985,1984,1983,1982
This statistics in other country:
AfghanistanAlbaniaAlgeriaAngolaAntigua and BarbudaArab WorldArgentinaArmeniaArubaAustraliaAustriaAzerbaijanBahamas, TheBahrainBangladeshBarbadosBelarusBelgiumBelizeBeninBermudaBhutanBoliviaBosnia and HerzegovinaBotswanaBrazilBrunei DarussalamBulgariaBurkina FasoBurundiCabo VerdeCambodiaCameroonCanadaCaribbean small statesCentral African RepublicCentral Europe and the BalticsChadChileChinaColombiaComorosCongo, Dem. Rep.Congo, Rep.Costa RicaCote d'IvoireCroatiaCubaCyprusCzech RepublicDenmarkDjiboutiDominicaDominican RepublicEarly-demographic dividendEast Asia & PacificEast Asia & Pacific (excluding high income)East Asia & Pacific (IDA & IBRD countries)EcuadorEgypt, Arab Rep.El SalvadorEquatorial GuineaEritreaEstoniaEthiopiaEuro areaEurope & Central AsiaEurope & Central Asia (excluding high income)Europe & Central Asia (IDA & IBRD countries)European UnionFaroe IslandsFijiFinlandFragile and conflict affected situationsFranceGabonGambia, TheGeorgiaGermanyGhanaGreeceGrenadaGuatemalaGuineaGuinea-BissauGuyanaHaitiHeavily indebted poor countries (HIPC)High incomeHondurasHong Kong SAR, ChinaHungaryIBRD onlyIcelandIDA & IBRD totalIDA blendIDA onlyIDA totalIndiaIndonesiaIran, Islamic Rep.IraqIrelandIsraelItalyJamaicaJapanJordanKazakhstanKenyaKiribatiKorea, Rep.KosovoKuwaitKyrgyz RepublicLao PDRLate-demographic dividendLatin America & Caribbean Latin America & Caribbean (excluding high income)Latin America & the Caribbean (IDA & IBRD countries)LatviaLeast developed countries: UN classificationLebanonLesothoLiberiaLibyaLithuaniaLow & middle incomeLow incomeLower middle incomeLuxembourgMacao SAR, ChinaMacedonia, FYRMadagascarMalawiMalaysiaMaldivesMaliMaltaMauritaniaMauritiusMexicoMicronesia, Fed. Sts.Middle East & North AfricaMiddle East & North Africa (excluding high income)Middle East & North Africa (IDA & IBRD countries)Middle incomeMoldovaMongoliaMontenegroMoroccoMozambiqueNamibiaNepalNetherlandsNew CaledoniaNew ZealandNicaraguaNigerNigeriaNorth AmericaNorwayOECD membersOmanOther small statesPakistanPanamaPapua New GuineaParaguayPeruPhilippinesPolandPortugalPost-demographic dividendPre-demographic dividendPuerto RicoQatarRomaniaRussian FederationRwandaSaudi ArabiaSenegalSerbiaSeychellesSierra LeoneSingaporeSlovak RepublicSloveniaSmall statesSolomon IslandsSouth AfricaSouth AsiaSouth Asia (IDA & IBRD)South SudanSpainSri LankaSt. Kitts and NevisSt. LuciaSt. Vincent and the GrenadinesSub-Saharan Africa Sub-Saharan Africa (excluding high income)Sub-Saharan Africa (IDA & IBRD countries)SudanSurinameSwazilandSwedenSwitzerlandSyrian Arab RepublicTajikistanTanzaniaThailandTimor-LesteTogoTongaTrinidad and TobagoTunisiaTurkeyTurkmenistanUgandaUkraineUnited Arab EmiratesUnited KingdomUnited StatesUpper middle incomeUruguayUzbekistanVanuatuVenezuela, RBVietnamWest Bank and GazaWorldYemen, Rep.ZambiaZimbabwe Timeline:
This timeline shows a graph from 1982 to 2016 of Sub-Saharan Africa (excluding high income). No data until 1981. Number of actual observations by date: 35.
Source name:
World Development Indicators
Source organization:
World Bank national accounts data, and OECD National Accounts data files.
Categories, topics:
Economy & Growth
Last updated:
apr 23, 2017
Indicators value changes by year
Minimum:
46.689 bln
jan 1, 1999
Maximum:
376.097 bln
jan 1, 2013
At the date of observation
Value
Absolute change
Change from previous value
jan 1, 1982
65.653 bln
+65.653 bln
0.0%
jan 1, 1983
53.894 bln
-11.759 bln
-17.91%
jan 1, 1984
53.084 bln
-810.082 mln
-1.5%
jan 1, 1985
48.219 bln
-4.865 bln
-9.17%
jan 1, 1986
47.149 bln
-1.069 bln
-2.22%
jan 1, 1987
48.97 bln
+1.82 bln
3.86%
jan 1, 1988
56.837 bln
+7.867 bln
16.07%
jan 1, 1989
61.092 bln
+4.255 bln
7.49%
jan 1, 1990
67.613 bln
+6.522 bln
10.68%
jan 1, 1991
63.927 bln
-3.687 bln
-5.45%
jan 1, 1992
63.355 bln
-572.249 mln
-0.9%
jan 1, 1993
54.522 bln
-8.832 bln
-13.94%
jan 1, 1994
51.615 bln
-2.908 bln
-5.33%
jan 1, 1995
53.243 bln
+1.628 bln
3.15%
jan 1, 1996
57.176 bln
+3.934 bln
7.39%
jan 1, 1997
59.759 bln
+2.582 bln
4.52%
jan 1, 1998
56.894 bln
-2.865 bln
-4.79%
jan 1, 1999
46.689 bln
-10.206 bln
-17.94%
jan 1, 2000
55.492 bln
+8.803 bln
18.85%
jan 1, 2001
75.102 bln
+19.61 bln
35.34%
jan 1, 2002
58.887 bln
-16.215 bln
-21.59%
jan 1, 2003
61.031 bln
+2.144 bln
3.64%
jan 1, 2004
76.027 bln
+14.996 bln
24.57%
jan 1, 2005
101.176 bln
+25.149 bln
33.08%
jan 1, 2006
126.406 bln
+25.231 bln
24.94%
jan 1, 2007
178.869 bln
+52.463 bln
41.5%
jan 1, 2008
181.74 bln
+2.871 bln
1.61%
jan 1, 2009
243.14 bln
+61.399 bln
33.78%
jan 1, 2010
174.534 bln
-68.606 bln
-28.22%
jan 1, 2011
295.605 bln
+121.071 bln
69.37%
jan 1, 2012
349.447 bln
+53.841 bln
18.21%
jan 1, 2013
376.097 bln
+26.651 bln
7.63%
jan 1, 2014
316.971 bln
-59.126 bln
-15.72%
jan 1, 2015
336.673 bln
+19.702 bln
6.22%
jan 1, 2016
239.81 bln
-96.863 bln
-28.77%
Ranking of countries by current statistics by years


Comments: