29
/
en
AIzaSyAYiBZKx7MnpbEhh9jyipgxe19OcubqV5w
April 1, 2024
157336
Iran, Islamic Rep.
IRN
true
2
1
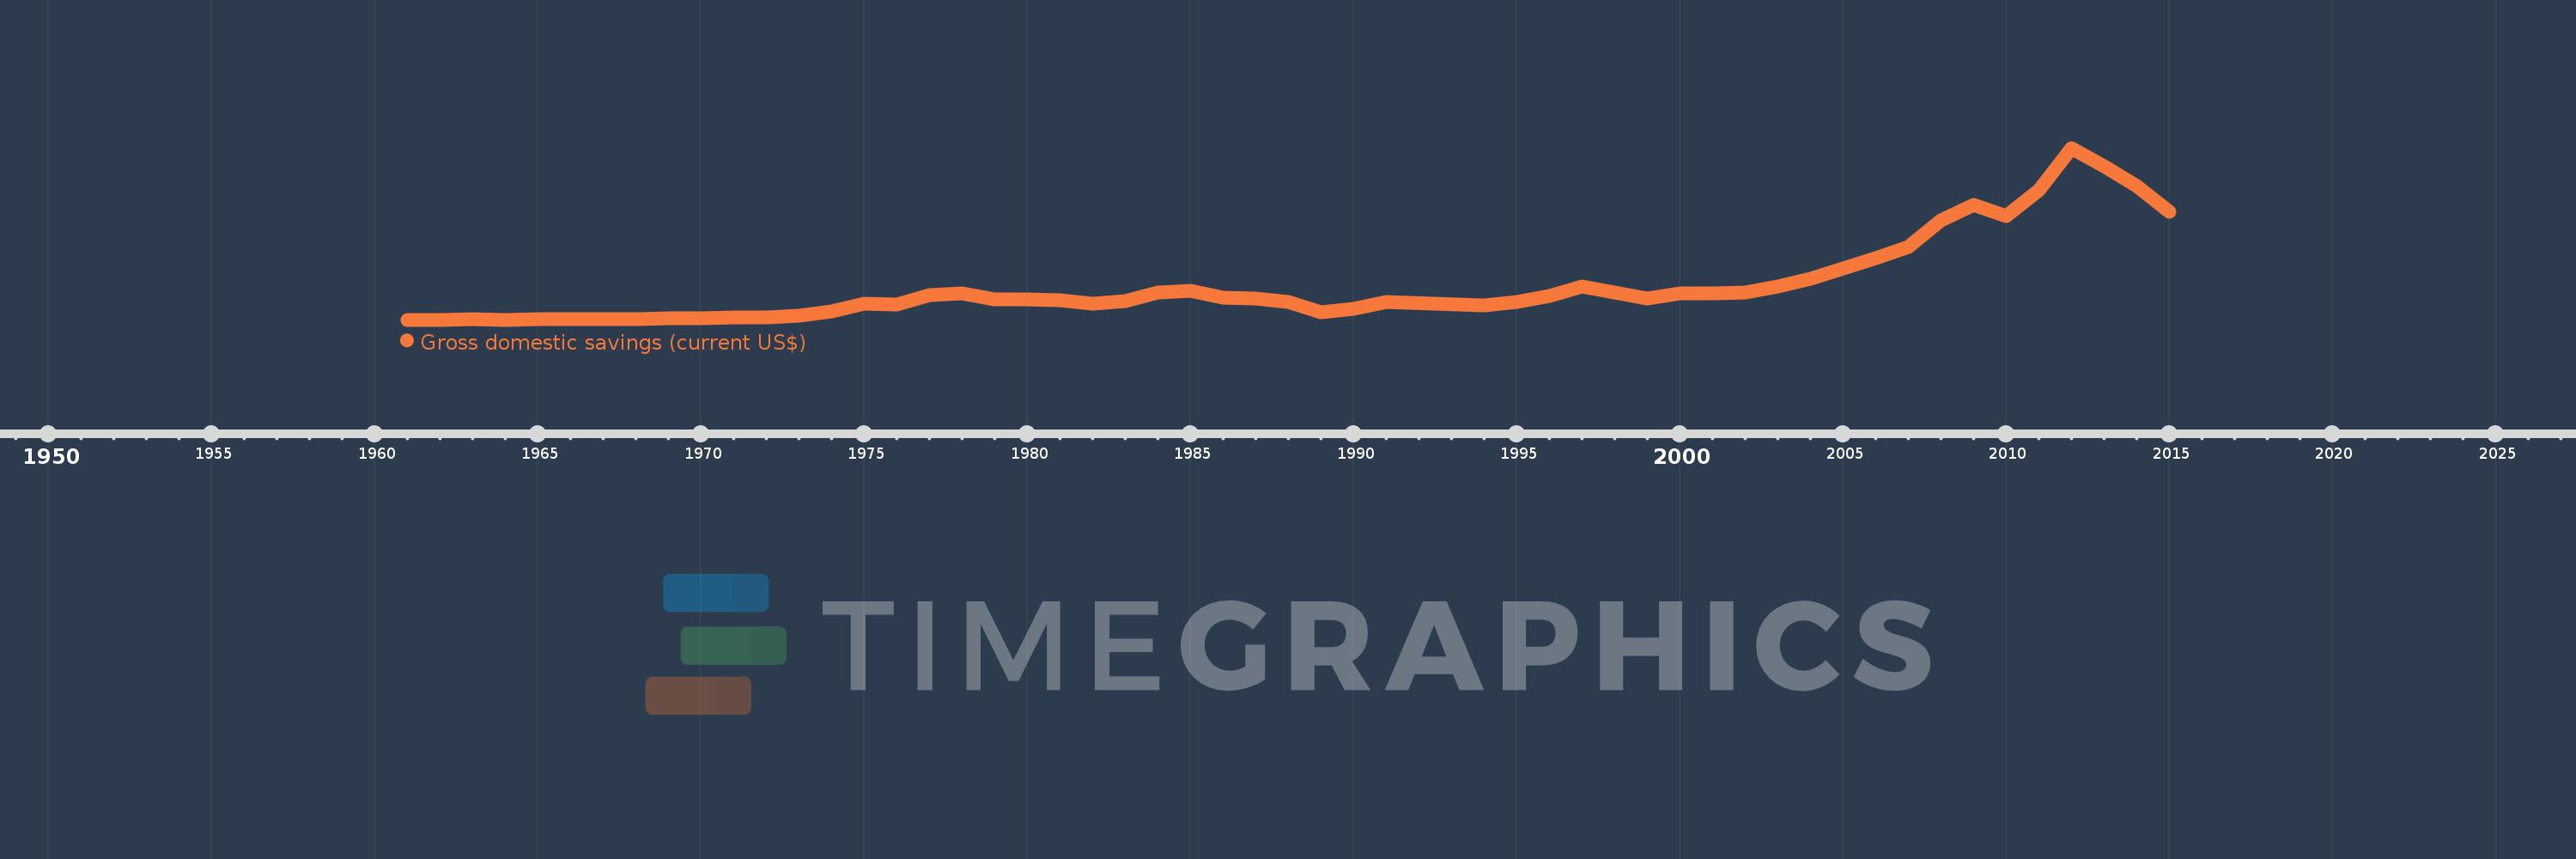
Gross domestic savings (current US$)
2015,2014,2013,2012,2011,2010,2009,2008,2007,2006,2005,2004,2003,2002,2001,2000,1999,1998,1997,1996,1995,1994,1991,1990,1989,1988,1987,1986,1985,1984,1983,1982,1981,1980,1979,1978,1977,1976,1975,1974,1973,1972,1971,1970,1969,1968,1967,1966,1965,1964,1963,1962,1961
This statistics in other country:
AfghanistanAlbaniaAlgeriaAngolaAntigua and BarbudaArab WorldArgentinaArmeniaArubaAustraliaAustriaAzerbaijanBahamas, TheBahrainBangladeshBarbadosBelarusBelgiumBelizeBeninBermudaBhutanBoliviaBosnia and HerzegovinaBotswanaBrazilBrunei DarussalamBulgariaBurkina FasoBurundiCabo VerdeCambodiaCameroonCanadaCaribbean small statesCentral African RepublicCentral Europe and the BalticsChadChileChinaColombiaComorosCongo, Dem. Rep.Congo, Rep.Costa RicaCote d'IvoireCroatiaCubaCyprusCzech RepublicDenmarkDjiboutiDominicaDominican RepublicEarly-demographic dividendEast Asia & PacificEast Asia & Pacific (excluding high income)East Asia & Pacific (IDA & IBRD countries)EcuadorEgypt, Arab Rep.El SalvadorEquatorial GuineaEritreaEstoniaEthiopiaEuro areaEurope & Central AsiaEurope & Central Asia (excluding high income)Europe & Central Asia (IDA & IBRD countries)European UnionFaroe IslandsFijiFinlandFragile and conflict affected situationsFranceGabonGambia, TheGeorgiaGermanyGhanaGreeceGrenadaGuatemalaGuineaGuinea-BissauGuyanaHaitiHeavily indebted poor countries (HIPC)High incomeHondurasHong Kong SAR, ChinaHungaryIBRD onlyIcelandIDA & IBRD totalIDA blendIDA onlyIDA totalIndiaIndonesiaIran, Islamic Rep.IraqIrelandIsraelItalyJamaicaJapanJordanKazakhstanKenyaKiribatiKorea, Rep.KosovoKuwaitKyrgyz RepublicLao PDRLate-demographic dividendLatin America & Caribbean Latin America & Caribbean (excluding high income)Latin America & the Caribbean (IDA & IBRD countries)LatviaLeast developed countries: UN classificationLebanonLesothoLiberiaLibyaLithuaniaLow & middle incomeLow incomeLower middle incomeLuxembourgMacao SAR, ChinaMacedonia, FYRMadagascarMalawiMalaysiaMaldivesMaliMaltaMauritaniaMauritiusMexicoMicronesia, Fed. Sts.Middle East & North AfricaMiddle East & North Africa (excluding high income)Middle East & North Africa (IDA & IBRD countries)Middle incomeMoldovaMongoliaMontenegroMoroccoMozambiqueNamibiaNepalNetherlandsNew CaledoniaNew ZealandNicaraguaNigerNigeriaNorth AmericaNorwayOECD membersOmanOther small statesPakistanPanamaPapua New GuineaParaguayPeruPhilippinesPolandPortugalPost-demographic dividendPre-demographic dividendPuerto RicoQatarRomaniaRussian FederationRwandaSaudi ArabiaSenegalSerbiaSeychellesSierra LeoneSingaporeSlovak RepublicSloveniaSmall statesSolomon IslandsSouth AfricaSouth AsiaSouth Asia (IDA & IBRD)South SudanSpainSri LankaSt. Kitts and NevisSt. LuciaSt. Vincent and the GrenadinesSub-Saharan Africa Sub-Saharan Africa (excluding high income)Sub-Saharan Africa (IDA & IBRD countries)SudanSurinameSwazilandSwedenSwitzerlandSyrian Arab RepublicTajikistanTanzaniaThailandTimor-LesteTogoTongaTrinidad and TobagoTunisiaTurkeyTurkmenistanUgandaUkraineUnited Arab EmiratesUnited KingdomUnited StatesUpper middle incomeUruguayUzbekistanVanuatuVenezuela, RBVietnamWest Bank and GazaWorldYemen, Rep.ZambiaZimbabwe Timeline:
This timeline shows a graph from 1961 to 2015 of Iran, Islamic Rep.. No data until 1960. Number of actual observations by date: 53.
Source name:
World Development Indicators
Source organization:
World Bank national accounts data, and OECD National Accounts data files.
Categories, topics:
Economy & Growth
Last updated:
apr 23, 2017
Indicators value changes by year
Minimum:
907.456 mln
jan 1, 1961
Maximum:
261.436 bln
jan 1, 2012
At the date of observation
Value
Absolute change
Change from previous value
jan 1, 1961
907.456 mln
+907.456 mln
0.0%
jan 1, 1962
1.02 bln
+112.993 mln
12.45%
jan 1, 1963
1.185 bln
+164.57 mln
16.13%
jan 1, 1964
1.09 bln
-95.144 mln
-8.03%
jan 1, 1965
1.435 bln
+345.451 mln
31.7%
jan 1, 1966
1.954 bln
+518.752 mln
36.14%
jan 1, 1967
2.234 bln
+279.839 mln
14.32%
jan 1, 1968
2.401 bln
+167.508 mln
7.5%
jan 1, 1969
3.309 bln
+907.123 mln
37.77%
jan 1, 1970
3.618 bln
+309.316 mln
9.35%
jan 1, 1971
4.16 bln
+542.187 mln
14.99%
jan 1, 1972
5.024 bln
+864.144 mln
20.77%
jan 1, 1973
7.127 bln
+2.103 bln
41.85%
jan 1, 1974
12.96 bln
+5.833 bln
81.85%
jan 1, 1975
25.122 bln
+12.162 bln
93.84%
jan 1, 1976
24.206 bln
-916.346 mln
-3.65%
jan 1, 1977
38.836 bln
+14.63 bln
60.44%
jan 1, 1978
40.406 bln
+1.57 bln
4.04%
jan 1, 1979
31.494 bln
-8.912 bln
-22.06%
jan 1, 1980
32.265 bln
+771.58 mln
2.45%
jan 1, 1981
31.002 bln
-1.263 bln
-3.92%
jan 1, 1982
24.625 bln
-6.378 bln
-20.57%
jan 1, 1983
28.83 bln
+4.205 bln
17.08%
jan 1, 1984
41.602 bln
+12.772 bln
44.3%
jan 1, 1985
45.012 bln
+3.41 bln
8.2%
jan 1, 1986
34.0 bln
-11.012 bln
-24.46%
jan 1, 1987
32.476 bln
-1.525 bln
-4.48%
jan 1, 1988
27.503 bln
-4.973 bln
-15.31%
jan 1, 1989
12.454 bln
-15.049 bln
-54.72%
jan 1, 1990
17.794 bln
+5.34 bln
42.88%
jan 1, 1991
28.081 bln
+10.287 bln
57.81%
jan 1, 1994
22.422 bln
-5.66 bln
-20.16%
jan 1, 1995
27.485 bln
+5.063 bln
22.58%
jan 1, 1996
37.014 bln
+9.529 bln
34.67%
jan 1, 1997
51.72 bln
+14.706 bln
39.73%
jan 1, 1998
42.662 bln
-9.058 bln
-17.51%
jan 1, 1999
33.08 bln
-9.581 bln
-22.46%
jan 1, 2000
41.259 bln
+8.179 bln
24.72%
jan 1, 2001
40.305 bln
-954.035 mln
-2.31%
jan 1, 2002
42.28 bln
+1.975 bln
4.9%
jan 1, 2003
51.077 bln
+8.797 bln
20.81%
jan 1, 2004
62.464 bln
+11.387 bln
22.29%
jan 1, 2005
78.863 bln
+16.399 bln
26.25%
jan 1, 2006
93.783 bln
+14.921 bln
18.92%
jan 1, 2007
110.758 bln
+16.975 bln
18.1%
jan 1, 2008
152.095 bln
+41.337 bln
37.32%
jan 1, 2009
175.16 bln
+23.064 bln
15.16%
jan 1, 2010
158.244 bln
-16.915 bln
-9.66%
jan 1, 2011
197.38 bln
+39.136 bln
24.73%
jan 1, 2012
261.436 bln
+64.056 bln
32.45%
jan 1, 2013
233.911 bln
-27.524 bln
-10.53%
jan 1, 2014
203.484 bln
-30.427 bln
-13.01%
jan 1, 2015
164.453 bln
-39.031 bln
-19.18%
Ranking of countries by current statistics by years


Comments: