29
/
en
AIzaSyAYiBZKx7MnpbEhh9jyipgxe19OcubqV5w
April 1, 2024
133195
Finland
FIN
true
2
1
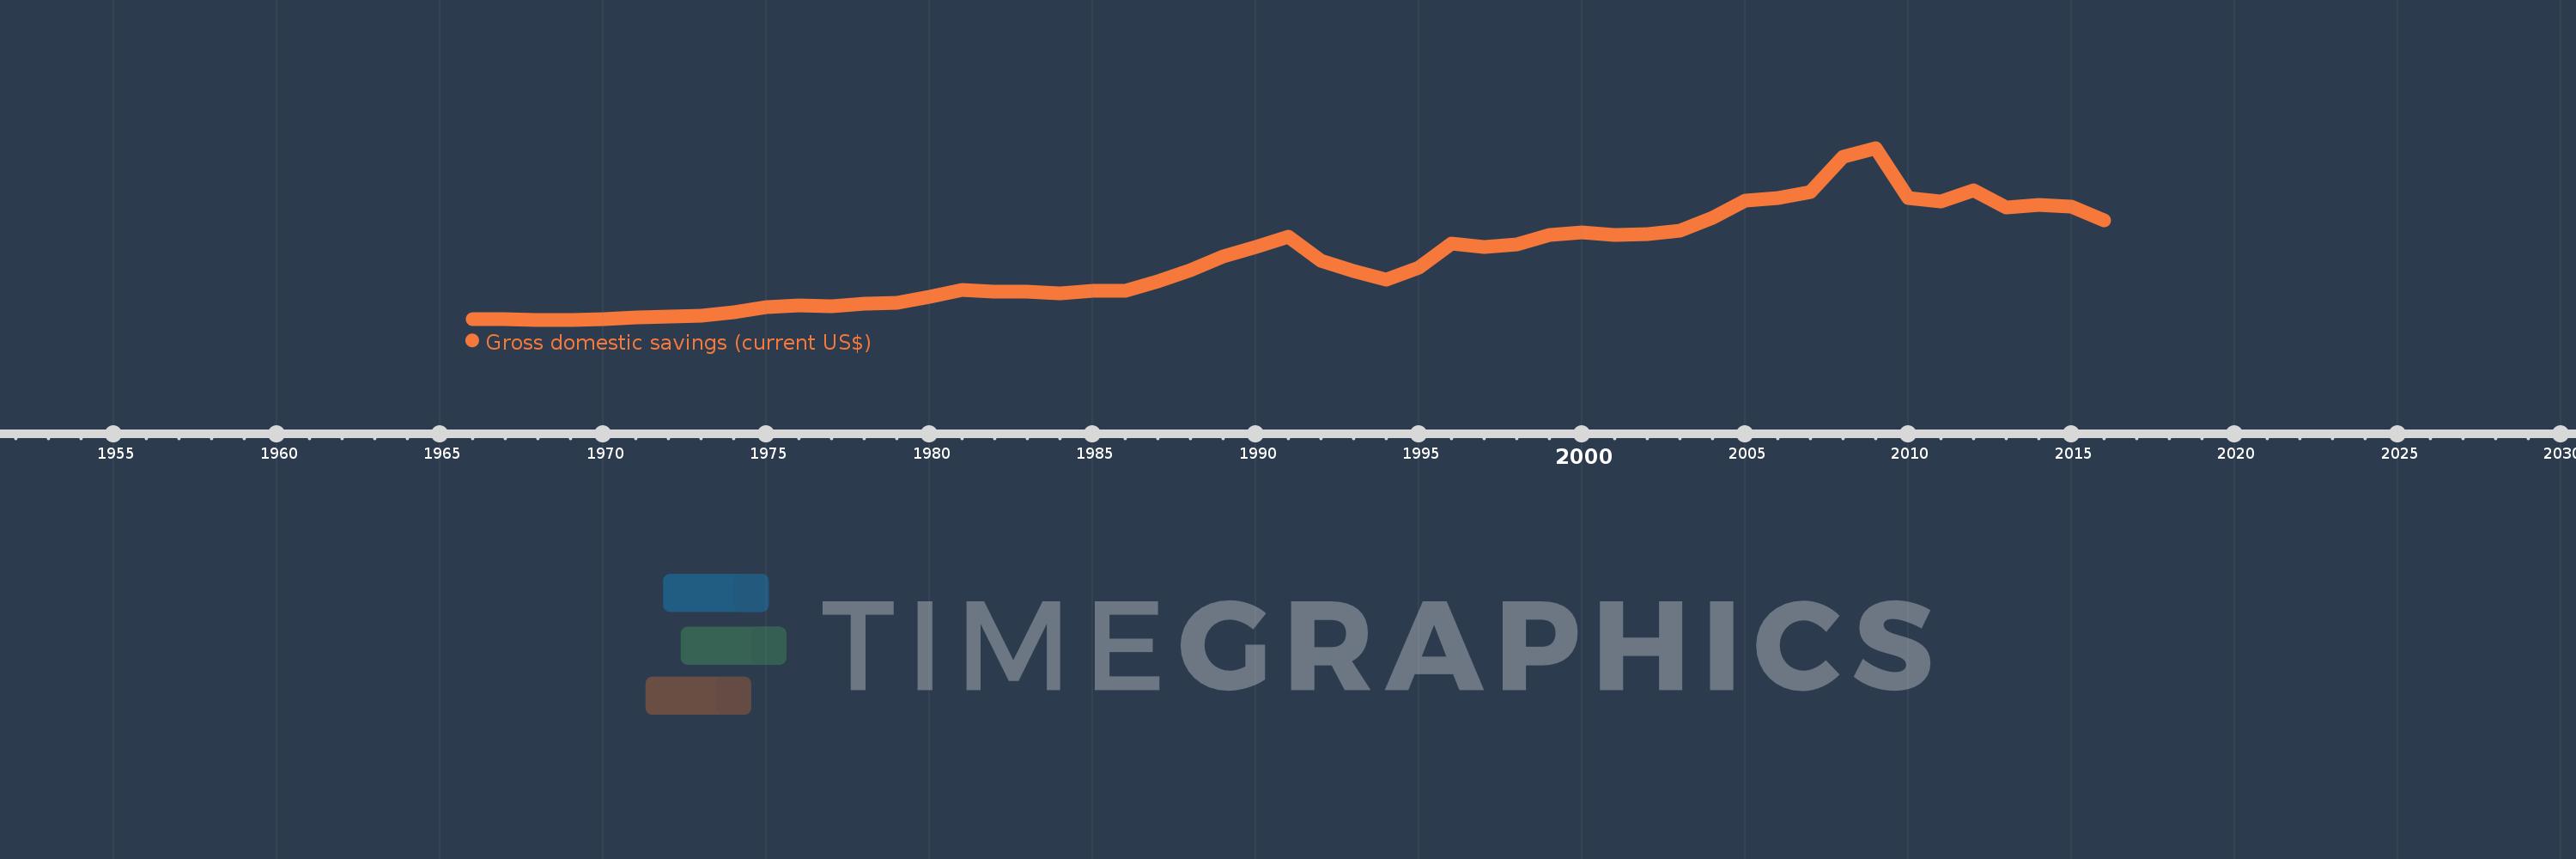
Gross domestic savings (current US$)
2016,2015,2014,2013,2012,2011,2010,2009,2008,2007,2006,2005,2004,2003,2002,2001,2000,1999,1998,1997,1996,1995,1994,1993,1992,1991,1990,1989,1988,1987,1986,1985,1984,1983,1982,1981,1980,1979,1978,1977,1976,1975,1974,1973,1972,1971,1970,1969,1968,1967,1966
This statistics in other country:
AfghanistanAlbaniaAlgeriaAngolaAntigua and BarbudaArab WorldArgentinaArmeniaArubaAustraliaAustriaAzerbaijanBahamas, TheBahrainBangladeshBarbadosBelarusBelgiumBelizeBeninBermudaBhutanBoliviaBosnia and HerzegovinaBotswanaBrazilBrunei DarussalamBulgariaBurkina FasoBurundiCabo VerdeCambodiaCameroonCanadaCaribbean small statesCentral African RepublicCentral Europe and the BalticsChadChileChinaColombiaComorosCongo, Dem. Rep.Congo, Rep.Costa RicaCote d'IvoireCroatiaCubaCyprusCzech RepublicDenmarkDjiboutiDominicaDominican RepublicEarly-demographic dividendEast Asia & PacificEast Asia & Pacific (excluding high income)East Asia & Pacific (IDA & IBRD countries)EcuadorEgypt, Arab Rep.El SalvadorEquatorial GuineaEritreaEstoniaEthiopiaEuro areaEurope & Central AsiaEurope & Central Asia (excluding high income)Europe & Central Asia (IDA & IBRD countries)European UnionFaroe IslandsFijiFinlandFragile and conflict affected situationsFranceGabonGambia, TheGeorgiaGermanyGhanaGreeceGrenadaGuatemalaGuineaGuinea-BissauGuyanaHaitiHeavily indebted poor countries (HIPC)High incomeHondurasHong Kong SAR, ChinaHungaryIBRD onlyIcelandIDA & IBRD totalIDA blendIDA onlyIDA totalIndiaIndonesiaIran, Islamic Rep.IraqIrelandIsraelItalyJamaicaJapanJordanKazakhstanKenyaKiribatiKorea, Rep.KosovoKuwaitKyrgyz RepublicLao PDRLate-demographic dividendLatin America & Caribbean Latin America & Caribbean (excluding high income)Latin America & the Caribbean (IDA & IBRD countries)LatviaLeast developed countries: UN classificationLebanonLesothoLiberiaLibyaLithuaniaLow & middle incomeLow incomeLower middle incomeLuxembourgMacao SAR, ChinaMacedonia, FYRMadagascarMalawiMalaysiaMaldivesMaliMaltaMauritaniaMauritiusMexicoMicronesia, Fed. Sts.Middle East & North AfricaMiddle East & North Africa (excluding high income)Middle East & North Africa (IDA & IBRD countries)Middle incomeMoldovaMongoliaMontenegroMoroccoMozambiqueNamibiaNepalNetherlandsNew CaledoniaNew ZealandNicaraguaNigerNigeriaNorth AmericaNorwayOECD membersOmanOther small statesPakistanPanamaPapua New GuineaParaguayPeruPhilippinesPolandPortugalPost-demographic dividendPre-demographic dividendPuerto RicoQatarRomaniaRussian FederationRwandaSaudi ArabiaSenegalSerbiaSeychellesSierra LeoneSingaporeSlovak RepublicSloveniaSmall statesSolomon IslandsSouth AfricaSouth AsiaSouth Asia (IDA & IBRD)South SudanSpainSri LankaSt. Kitts and NevisSt. LuciaSt. Vincent and the GrenadinesSub-Saharan Africa Sub-Saharan Africa (excluding high income)Sub-Saharan Africa (IDA & IBRD countries)SudanSurinameSwazilandSwedenSwitzerlandSyrian Arab RepublicTajikistanTanzaniaThailandTimor-LesteTogoTongaTrinidad and TobagoTunisiaTurkeyTurkmenistanUgandaUkraineUnited Arab EmiratesUnited KingdomUnited StatesUpper middle incomeUruguayUzbekistanVanuatuVenezuela, RBVietnamWest Bank and GazaWorldYemen, Rep.ZambiaZimbabwe Timeline:
This timeline shows a graph from 1966 to 2016 of Finland. No data until 1965. Number of actual observations by date: 51.
Source name:
World Development Indicators
Source organization:
World Bank national accounts data, and OECD National Accounts data files.
Categories, topics:
Economy & Growth
Last updated:
apr 23, 2017
Indicators value changes by year
Minimum:
2.262 bln
jan 1, 1968
Maximum:
81.563 bln
jan 1, 2009
At the date of observation
Value
Absolute change
Change from previous value
jan 1, 1966
2.371 bln
+2.371 bln
0.0%
jan 1, 1967
2.408 bln
+36.868 mln
1.55%
jan 1, 1968
2.262 bln
-145.513 mln
-6.04%
jan 1, 1969
2.334 bln
+71.204 mln
3.15%
jan 1, 1970
2.653 bln
+318.992 mln
13.67%
jan 1, 1971
3.424 bln
+770.881 mln
29.06%
jan 1, 1972
3.713 bln
+289.405 mln
8.45%
jan 1, 1973
4.265 bln
+552.556 mln
14.88%
jan 1, 1974
5.763 bln
+1.498 bln
35.12%
jan 1, 1975
8.244 bln
+2.481 bln
43.04%
jan 1, 1976
8.872 bln
+628.332 mln
7.62%
jan 1, 1977
8.617 bln
-255.773 mln
-2.88%
jan 1, 1978
9.816 bln
+1.199 bln
13.92%
jan 1, 1979
9.967 bln
+151.734 mln
1.55%
jan 1, 1980
12.815 bln
+2.847 bln
28.57%
jan 1, 1981
16.065 bln
+3.25 bln
25.36%
jan 1, 1982
15.406 bln
-658.263 mln
-4.1%
jan 1, 1983
15.23 bln
-176.4 mln
-1.14%
jan 1, 1984
14.468 bln
-761.645 mln
-5.0%
jan 1, 1985
15.655 bln
+1.187 bln
8.2%
jan 1, 1986
15.43 bln
-225.149 mln
-1.44%
jan 1, 1987
20.123 bln
+4.693 bln
30.42%
jan 1, 1988
25.024 bln
+4.901 bln
24.35%
jan 1, 1989
31.36 bln
+6.337 bln
25.32%
jan 1, 1990
35.906 bln
+4.545 bln
14.49%
jan 1, 1991
40.432 bln
+4.527 bln
12.61%
jan 1, 1992
29.568 bln
-10.865 bln
-26.87%
jan 1, 1993
24.663 bln
-4.905 bln
-16.59%
jan 1, 1994
20.679 bln
-3.984 bln
-16.15%
jan 1, 1995
26.239 bln
+5.56 bln
26.89%
jan 1, 1996
37.305 bln
+11.066 bln
42.17%
jan 1, 1997
35.88 bln
-1.425 bln
-3.82%
jan 1, 1998
36.914 bln
+1.034 bln
2.88%
jan 1, 1999
41.45 bln
+4.535 bln
12.29%
jan 1, 2000
42.421 bln
+970.916 mln
2.34%
jan 1, 2001
41.52 bln
-900.45 mln
-2.12%
jan 1, 2002
41.832 bln
+311.59 mln
0.75%
jan 1, 2003
43.205 bln
+1.374 bln
3.28%
jan 1, 2004
49.175 bln
+5.97 bln
13.82%
jan 1, 2005
57.251 bln
+8.076 bln
16.42%
jan 1, 2006
58.326 bln
+1.075 bln
1.88%
jan 1, 2007
61.026 bln
+2.7 bln
4.63%
jan 1, 2008
77.427 bln
+16.401 bln
26.87%
jan 1, 2009
81.563 bln
+4.136 bln
5.34%
jan 1, 2010
58.444 bln
-23.119 bln
-28.34%
jan 1, 2011
56.751 bln
-1.693 bln
-2.9%
jan 1, 2012
62.006 bln
+5.255 bln
9.26%
jan 1, 2013
54.124 bln
-7.882 bln
-12.71%
jan 1, 2014
55.433 bln
+1.31 bln
2.42%
jan 1, 2015
54.562 bln
-871.244 mln
-1.57%
jan 1, 2016
47.965 bln
-6.597 bln
-12.09%
Ranking of countries by current statistics by years


Comments: